
.svg)

Share
Open a cryptocurrency account and earn profits from digital currencies.


Related articles
Author
Constantine Blake
In the ever-fluctuating world of trading, there are fewer patterns with a name and credible reliability like those of the inverse head and shoulder. Twice as frequently observed at the bottoms of market trends as at the tops, this reversal pattern has helped traders predict dramatic reversals of trends through Forex charts, cryptocurrency, and equities markets. However, recognition of the pattern is not enough—understanding how to trade it with clarity is what separates winners from aspiring dreamers.
This article will explain to you how to trade the inverse head and shoulders formation with confidence here in this tutorial, how to identify it with all the best tools, and apply state-of-the-art strategies optimized for 2025 trading environments.
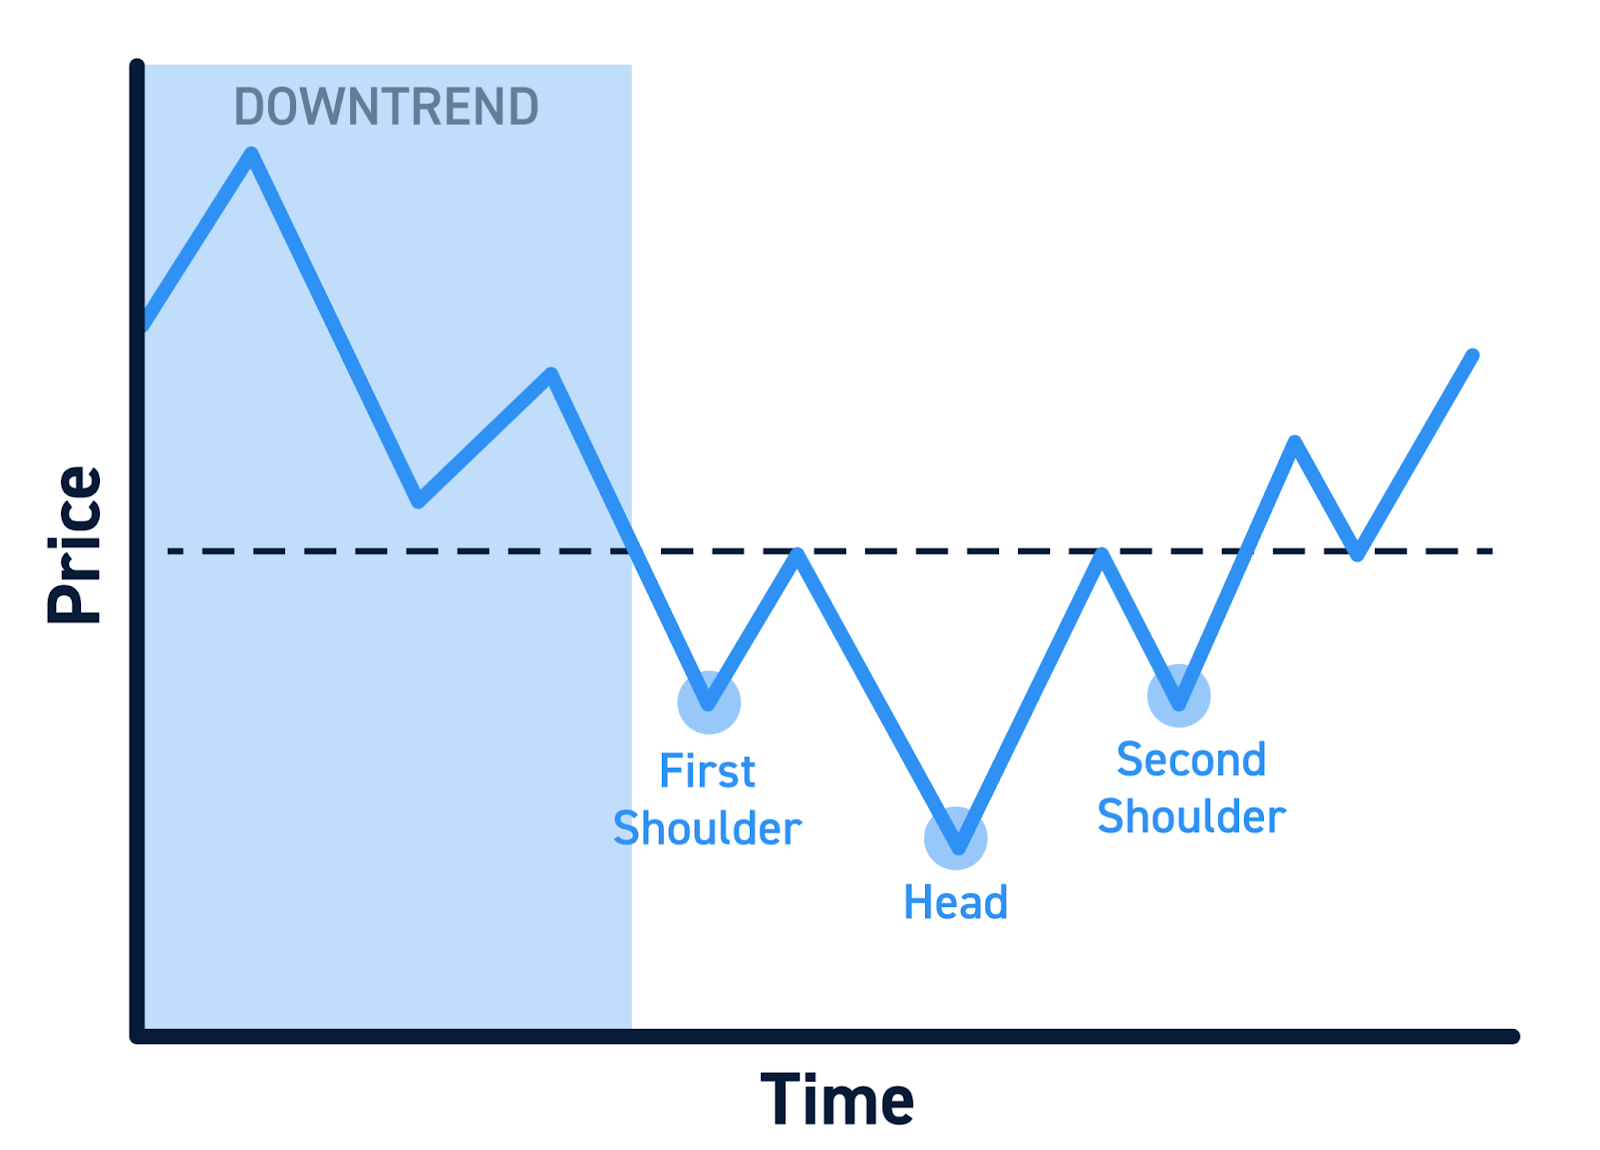
The inverse head and shoulders is an ageless reversal pattern observed after a long downtrend and signals that there is a shift of sentiment from bear to bull.
It is the inverse form of the original head and shoulders pattern and is a bearish reversal signal. The formation is looked at by traders and technical analysts as one of the strongest indicators of a bottoming formation and the beginning of a new upsurge trend.
The Inverse Head and Shoulders pattern tends to mature through a series of phases and periods of time, and though the pattern varies to some extent depending upon situations in the marketplace, its intrinsic symmetry is most important. The left shoulder is formed when sellers drive the price to a local bottom before buyers move in.
The rebound can't break through resistance, and the price falls to an entirely different bottom—this is the head of the pattern. Pay close attention to the fact that volume during head formation is diminishing and declining,_signifying declining selling pressure. The price recovers once again and rises to a similar level of resistance as before.
The right shoulder follows with a less steep decline. This time, however, selling interest is noticeably weaker, and support for the price is located above the previous trough. The neckline connects the peaks between the shoulders and the head and is a key trigger level.
Once it gets above this neckline—preferably accompanied by a surge in volume—it suggests buying strength has rallied forcefully and a bullish trend is imminent
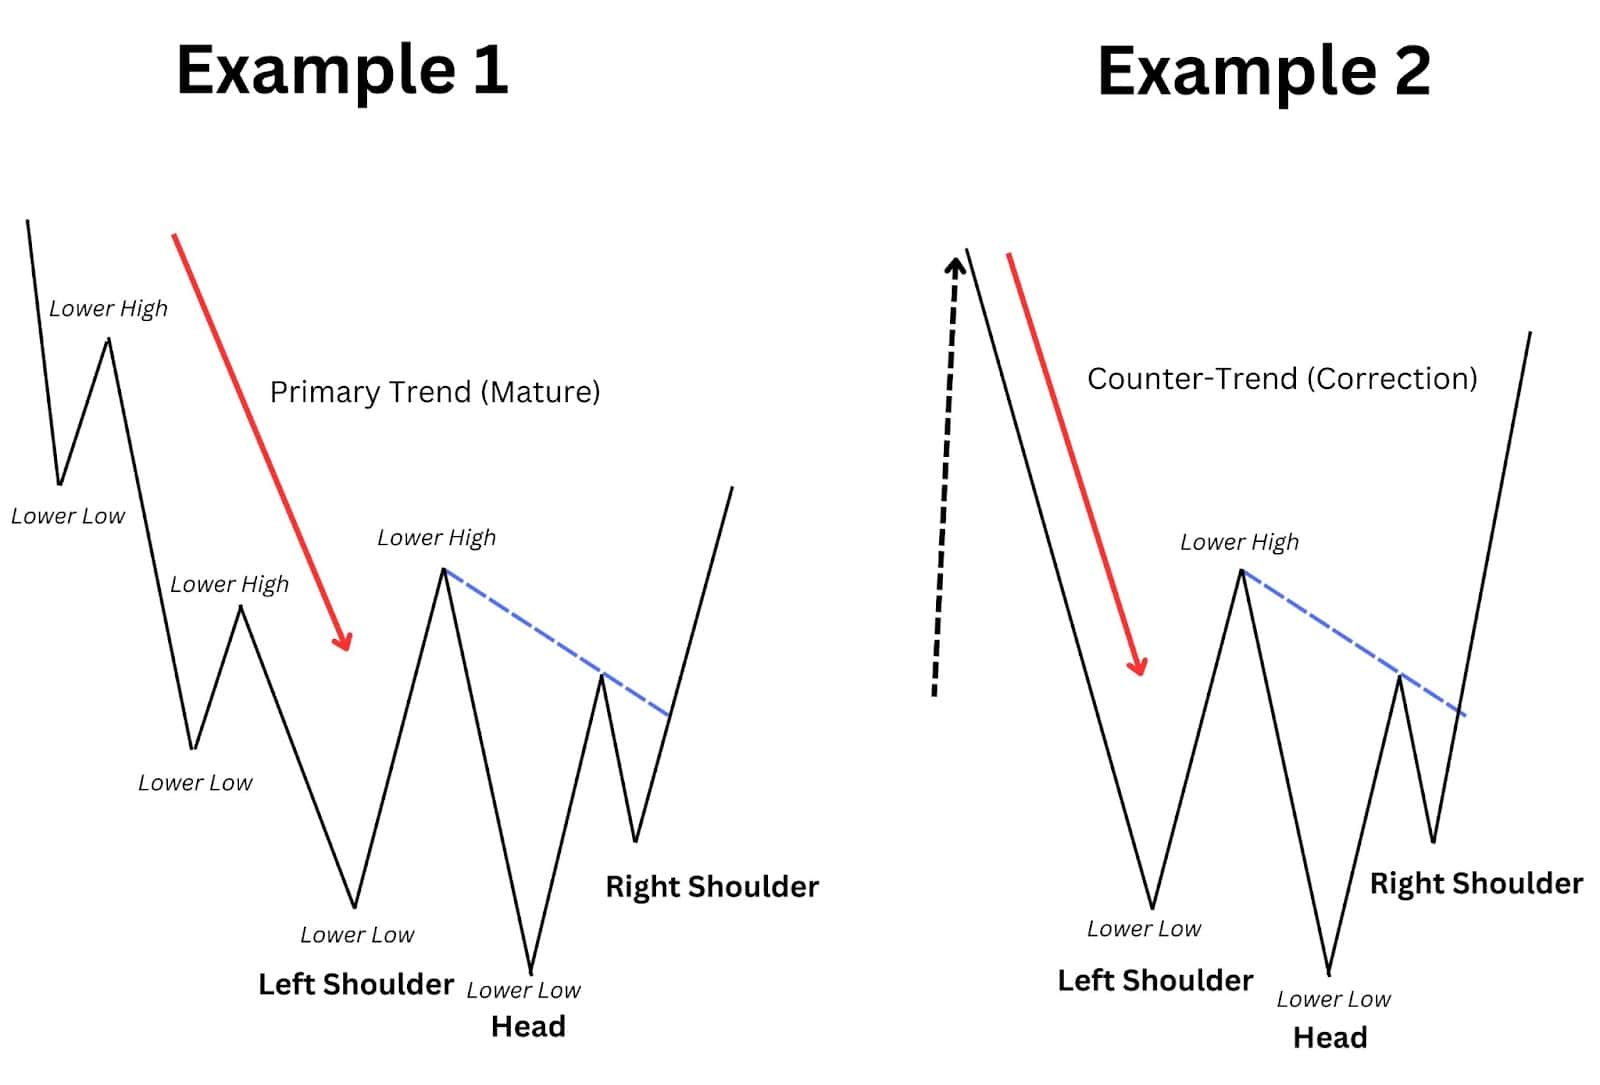
To successfully trade the inverse head and shoulders pattern, it is vital to understand its structural anatomy. It is an ageless reversal formation comprised of clear-cut constituents, indicating a protracted shift in market supremacy—either from sellers to buyers and vice versa. Let's break it down clearly:
The pattern begins with the left shoulder formed following a steady downtrend. The sellers are still dominating at this point and are driving the price down to a local low.
However, this low is not sustained, and a weak rally ensues as some buyers return or as short squeezes are unwound by taking profits. This back-to-the-future rally ends this first leg down.
The clue is that the bounce off the left shoulder is not enough to change direction—a pause, essentially, but not a turning point—but it provides the foundation for the head to form and a reference point for later at the neckline.
The price drops once again after the left shoulder and develops a lower low to complete the head, the lowest point throughout the entire pattern. This is when the market is seemingly most bearish and typically triggers panic selling by means of stop-loss cascades. However, long afterwards is a sharp rebound.
This bounce is an inflection point of key significance. This is a subtle yet critical change: whereas sellers have brought the price down, the strength of the bounce is a sign of increasing buying demand. Volume at the head formation is usually subdued, suggesting bearish exhaustion.
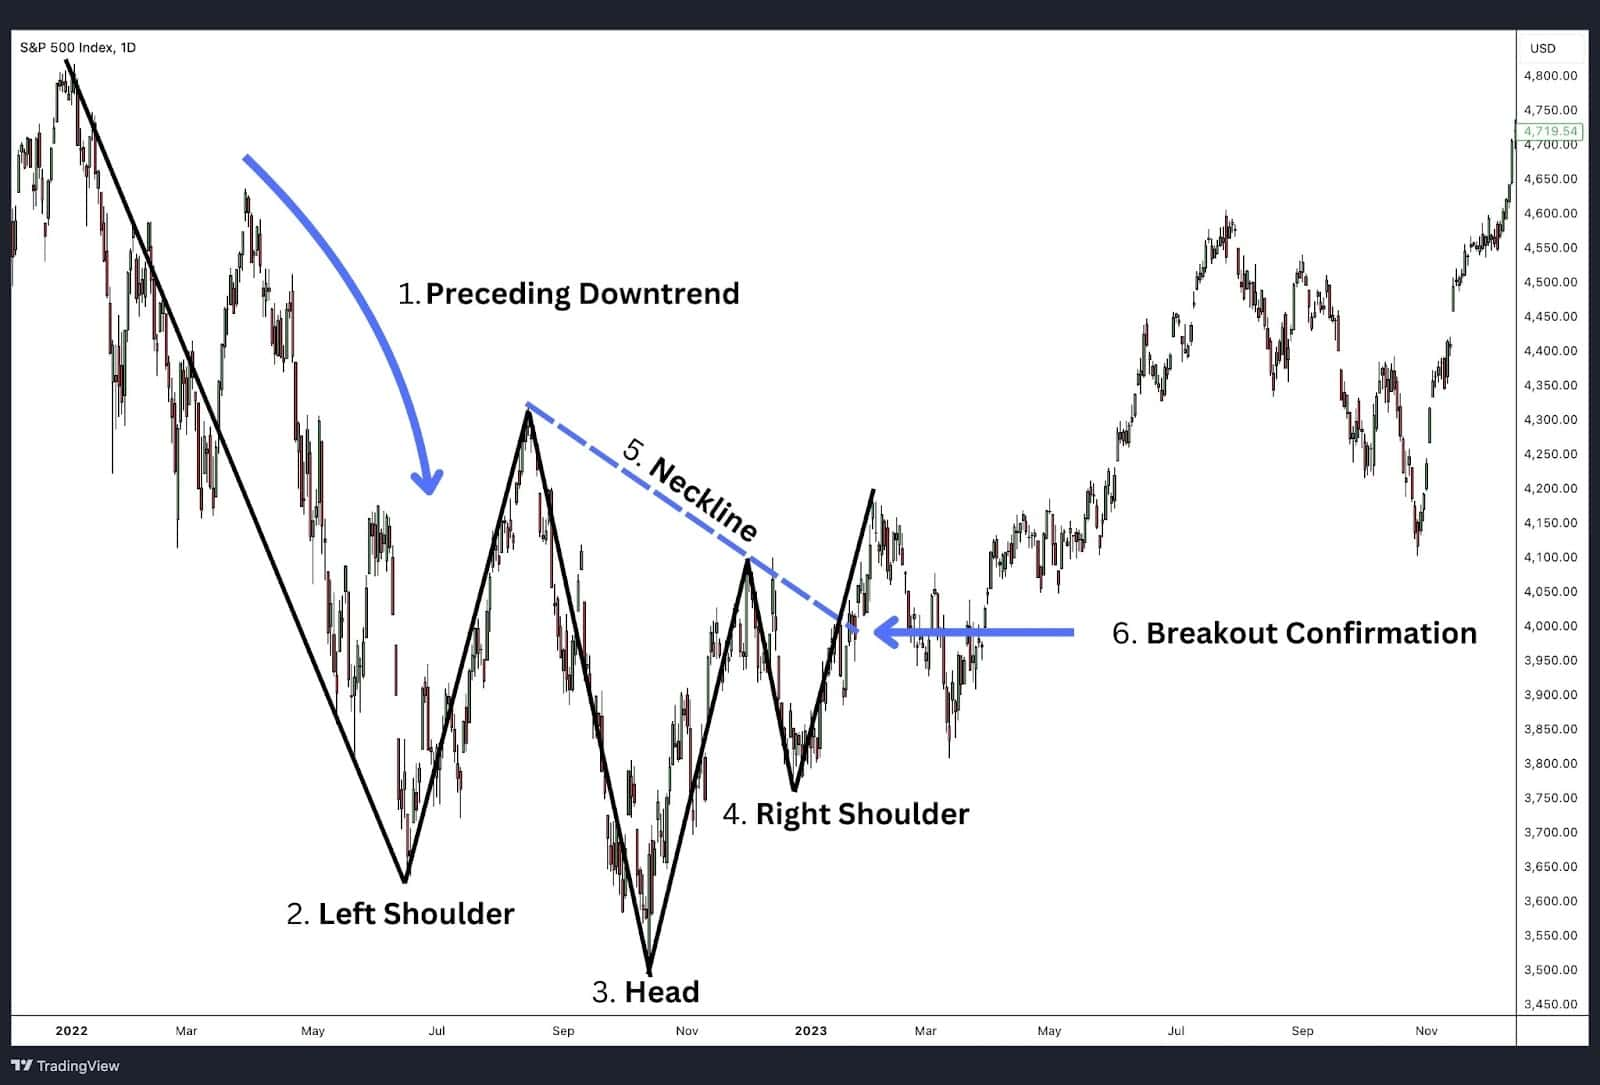
The neckline is formed when the price returns to the area of resistance (almost equal to the high from the left shoulder to the head).
The right shoulder is created when the price pulls back one last time—but less sharply than the head. As can be appreciated, the left shoulder has to be lower still than the head to maintain symmetry and is best at the same depth as the left shoulder for aesthetic reasons. The higher low is by far the strongest clue towards diminishing bearish vigor.
The formation at the right shoulder develops with diminishing volume, indicating fading interest in selling. The traders see it as a probable site for accumulation, whereby buyers quietly build up positions before a breakout.
The neckline is defined by connecting two highs below the shoulder and at the head. This is the final region of resistance. The neckline is generally horizontal but can slope gently upward or downward during volatility and price movement in the marketplace.
The breakout through the neckline is the defining action for the pattern. A clear and powerful move—especially when reinforced by volume validation—declares the shift to bullish from bearish sentiment.
The traders often use this breakout point as a starting position for long trades with stops lower than the right shoulder or head from a risk standpoint.
Trading with profits from the Inverse Head and Shoulders pattern is equally about pattern recognition and strategic trading. Once you find and verify the pattern, you should outline your entry, stop-loss, and profit targets to fit your risk tolerance and style of trading. This is a step-by-step trading approach to this powerful reversal pattern.
The key stimulus to go long with the Inverse Head and Shoulders pattern is a reliable breakout through the neckline. The breakout signals a decisive change of direction—a change from bearish to bullish—and is often accompanied by the beginning of a fresh uptrend.
However, not all breakouts are genuine. To reduce the chances of getting a false signal, traders can wait for confirmation through a daily candle close above the neckline, a noticeable jump in volume, or an explicit bullish price action, such as a momentum candle or engulfing formation.
There are two primary methods for timing entries. The aggressive entry is to enter at the breakout of the neckline. This is most suitable when it involves a high-conviction trade, particularly in fast-moving marketplaces like cryptocurrency trading or small-cap stocks. The advantage is the most significant profit potential, whereas the risk is a high chance of falling prey to false breakouts if confirmation is weak.
On the other hand, a conservative trade is to wait until the price breaks out and reverses to retest the neckline. Your buying signal is triggered once the neckline offers new support, typically with a resultant bullish reversal candle.
This approach has a better opportunity to succeed, but there is always the risk that the price continues to move up without a retest, and the trade is missed. The traders can validate either strategy using momentum signals, such as RSI or MACD, to ensure there is support below.
A stop-loss is crucial to risk management and the avoidance of significant losses. For an IHS case, a reasonable and technical stop can either be set at just below the right shoulder or below the head.
Placing the stop below the shoulder to its right is a safer approach—more constricted with a greater risk-to-reward ratio, but with a greater chance to get stopped out by corrective noise. Riskier by scale, yet a stop below the head offers greater breathing room and is optimal for swing traders trading with larger timeframes.
Traders can utilize the Average True Range (ATR) indicator to add precision and versatility. The ATR-based stops take care of recent volatility, so risk management can dynamically change.
For instance, a trader can subtract 1.5 ATR from their entry price to achieve a reasonable stop distance. The strategy eliminates erratic price movements and tail wicks that would lead to early termination.
The key to optimal pattern performance is to determine realistic and technically sound profit goals. The most common practice is to take the height of the vertical distance from the bottom of the pattern at the head to the neckline and project it upward from the point of breakout.
For example, if the head began at $80 and the neckline at $100, the approximated target would be around $120. This gives traders a point to begin expecting from, although it is always a good thing to also look at close areas of resistance, Fibonacci extensions, or prior supply areas as potential points for exiting.
There are two trade-exit possibilities. Scaling out is a system of liquidating partial profits at pre-determined points and maintaining a trailing stop-loss on the balance of the position. This helps ensure profits and alleviates emotional tension associated with working a full workload.
Or a fixed-target strategy is less hands-on: the trader eliminates the entire position at the predicted cost goal. This is a straightforward, predictable strategy that is efficient with rule-based or automated trading programs.
It is tedious and error-prone to eyeball chart patterns like the Inverse Head and Shoulders (IHS) manually in today's fast-moving markets—especially when you are tracking various instruments and timeframes.
Fortunately, trading platforms and analytical tools these days are advanced enough to enable traders to automatically detect, analyze, and verify the IHS pattern quickly and precisely.
The tools and websites listed below are the best to help you identify and trade IHS formations in 2025:

TradingView is still everyone's go-to site for pattern-based technical analysis with its intuitive charting interface and vast repository of indicators.
It has its innate pattern recognition functionality to automatically highlight inverse head and shoulder shapes across all time scales. What makes it stand out is being able to enter customizable alerts, such as having it go off when the neckline is broken or volume is at some threshold.
Additionally, traders can write their IHS-detection programs by employing the Pine Script scripting language or can benefit from community-submitted scripts published at TradingView. The majority of these scripts detect the pattern and mark probable areas of entry and stop-loss.

MetaTrader 5 is well-liked by Forex and CFD traders and offers sophisticated charting and customizable indicators through its MQL5 community. The traders can incorporate pattern-recognition indicators that seek out classical formations, like IHS formations.
What is strong with MT5 in 2025 is its combination with AI-powered plugins, which utilize historical data and artificial intelligence to enhance pattern recognition and increase accuracy.
By using computerized trades via Expert Advisors (EAs), MT5 traders can detect the IHS pattern and trade based on predefined logic.

TrendSpider is a state-of-the-art AI-powered technical analysis system that has revolutionized trade techniques as far as chart patterns are concerned. The automated pattern detection engine can identify IHS patterns in any asset with a high level of accuracy and speed.
In comparison with scanners, TrendSpider combines multi-timeframe analysis, automatic trendline detection, and volume heat maps to make it easier to confirm whether a pattern is reliable.
They can set up alerts based on pattern breakouts, retraces, volume levels, and yes, backtest pattern performance through historical data, perfect for data-driven traders who want to have an edge.

Finviz Elite is a powerful stock trading screener that accepts pattern-based filters. It lacks real-time charting automation like that found at TrendSpider and TradingView, but it will allow you to sift through stocks by thousands based upon technical pattern specifications like inverse head and shoulder formations.
With performance measures and up-to-the-minute information, Finviz is a useful sidekick to swing traders who want to short-list stocks with bullish reversal formations fast and study them later on sophisticated sites.
These are specialty services with sole automated recognition of formations in chart patterns. They offer browser tools and downloadable screens to determine IHS and several other formations. Some tools even provide pattern reliability scores to offer traders a statistical edge before investing funds.
Less customizable than services like TradingView, these services are worth considering for pattern-based traders who want to add healthy technical scans to their workflow but don't want excessive scripting and technical setup.
By 2025, traders will mostly create or lease their own algorithmic programs and trading robots with pattern recognition capabilities. They integrate price action logic, studies of volume, and AI-driven pattern recognition to automatically categorize inverse head and shoulder formations. They'll interface with platforms such as MetaTrader, NinjaTrader, or custom Python dashboards through APIs.
These tools are often paired by institutional and pro traders with real-time news feeds, volatility filters, and liquidity tracking programs to pinpoint entries and exits based on the pattern.
The inverse head and shoulder formation is more than a textbook pattern—a powerful signal of shifts in market sentiment. Regardless of whether you're trading the Forex chart, cryptocurrency markets, or shares, learning to trade this bullish reversal formation can unveil high-probability entry positions during critical trend shifts.
With appropriate tools, clear entries and exits, and reliable confirmation signals, this timeless price action pattern is a perennial favourite among 2025 savvy traders. Remember: it's less about recognizing the pattern and more about trading it with confidence and reliability.
Explore more pattern trading guides and tools at Atmexx.
The inverse head and shoulders is a bullish formation.
It's a bullish reversal pattern that typically appears after a downtrend.
How is the head and shoulders pattern different from its reverse?
The normal pattern anticipates a bearish reversal, and its inverse counterpart predicts a bullish one.
Can I use this pattern on a Forex graph?
Indeed, it works extremely well with Forex charts, and especially with trending currency pairs.
The strongest confirmation for a reverse head and shoulders is:
A rally through the neckline, ideally with heavy volume.
Does this pattern work for short timeframes?
True, it is more reliable at larger scales, such as 4H, daily, or weekly charts.