
.svg)

Share
Open a cryptocurrency account and earn profits from digital currencies.

Related articles
Author
Constantine Blake
Every chart has a story to tell — of strength, of exhaustion, and of sleeper momentum. Divergence trading breaks the code by pinpointing where the price action and the indicators disagree, indicating that a trend is running out of gas.
By combining ICT trading strategy concepts and SMT divergence analysis, traders can pinpoint where liquidity flow occurs and where momentum shifts take place before they become evident.
This is a smarter, deeper way of reading the markets — whether it's the major FX pairs or the crypto crosses — and translating technical signals into high-probability setups.
Divergence trading involves identifying when the movement of the price and technical indicators disagrees — a signal that momentum is slowing. For example, when the price creates a new high but the RSI creates a lower high, it indicates that the buying momentum is slowing, and a reversal is imminent.
Essentially, divergence suggests what's happening under the influence of the price and thereby provides early notice of potential exhaustion in the trend.

Divergence is a pre-alarm. It gives you advance warning of turns, validates weakening momentum, and prevents false breakouts. It doesn't foretell definitive tops or bottoms, but it gives useful background for when a trend is losing its steam.
Divergence occurs in various versions, each telling a different tale regarding price momentum and market sentiment. Some are announcing a potential reversal for a given trend while validating its continuation or revealing poor participation driving the move.
Differing such insights assist traders in better understanding price action and making the soundest timing decisions between both the crypto and FX fields.
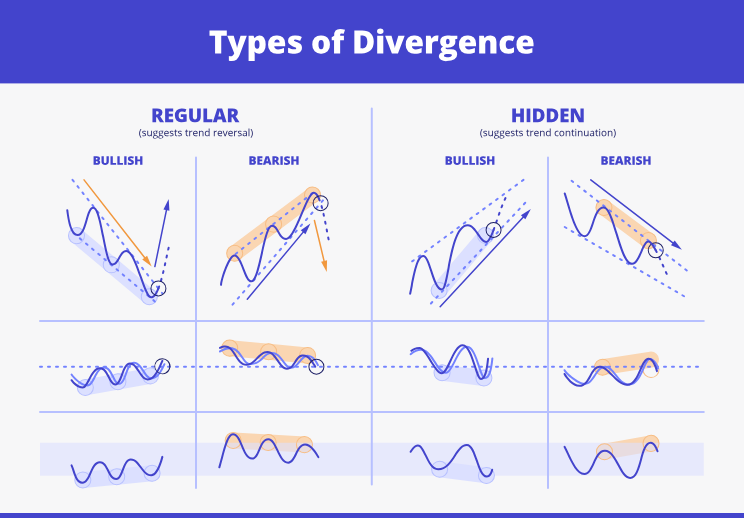
Periodic divergence occurs when a new high or low for the price is established, but the gauge doesn't verify it. This discord indicates that momentum in the market is diminishing, and a reversal is imminent.
For example, if a higher high is registered by the price but RSI draws a lower high, buying momentum is dying — a signal for bears. Conversely, a bullish configuration occurs when the price registers a lower low but the RSI plots a higher low, indicating that sellers are running out of steam.
The majority of traders will wait for a confirmation candle or structure break before entering a trade. If regular divergence occurs alongside confluence issues such as support/resistance or liquidity sweeps, it serves as a good early warning that the trend may be set to change direction.
Hidden divergence in a trending active direction indicates that the trend will continue after a pull.
During an uptrend, the price forms a higher low, but the index forms a lower low, indicating that fleeting frailty disguises renewed bullish drive. On a downtrend, the price establishes a lower high, but the index creates a higher high, which indicates sellers are again dominant.
Hidden divergence is safest when the price retractor goes back into major areas such as order blocks, fair value gaps, or averages. It provides a great entry point once confirmed by a break back into the direction of the trend with defined risk parameters.
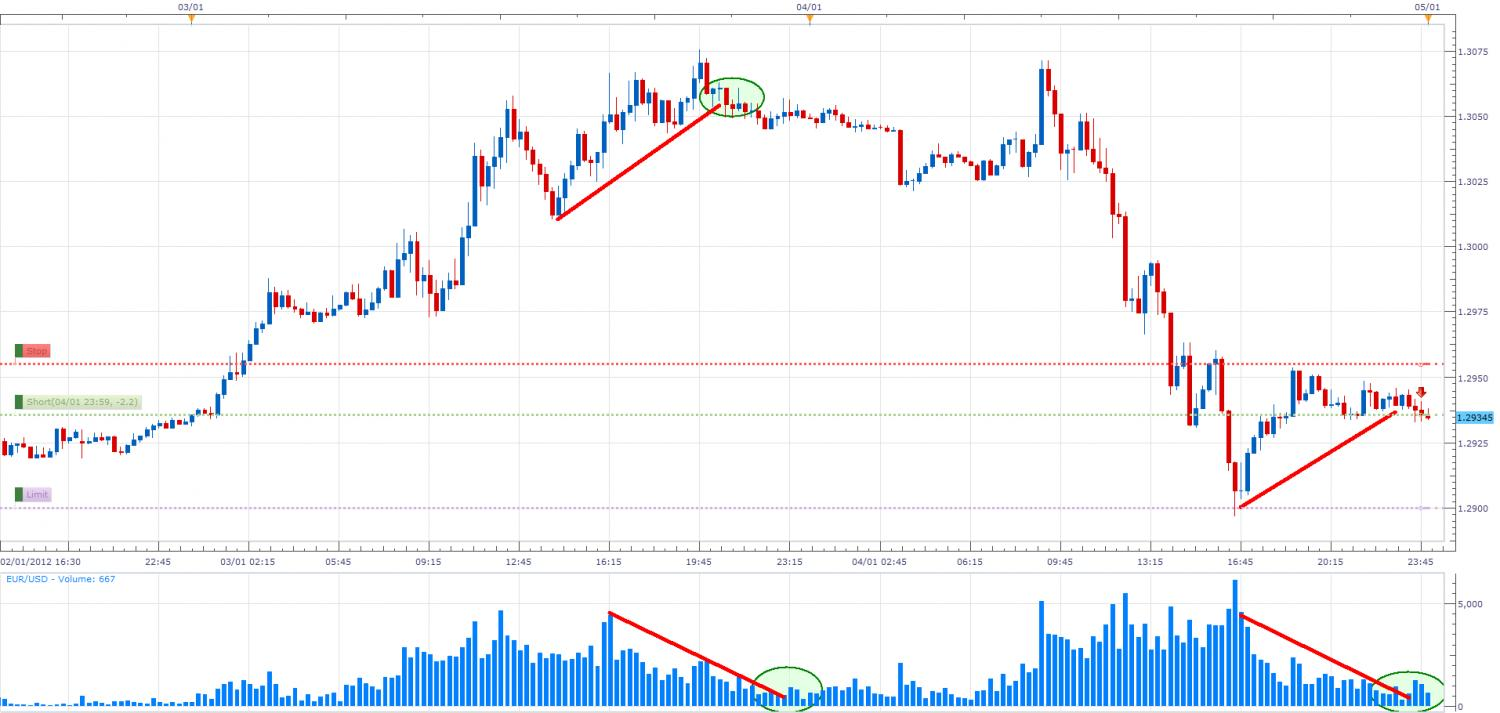
Participation Volume divergence occurs when the price action and activity diverge. If the price rises, but the volume goes lower, it indicates poor participation — that the rally may be losing true support.
Likewise, when the lower price reaches new lows and is accompanied by decreasing volume, it indicates the exhaustion of sellers and a potential bounce back. In crypto markets where liquidity varies frequently, volume divergence provides valuable information about whether moves are supported by genuine demand or speculative momentum.
Used together with RSI or MACD divergence, it gives powerful corroboration that momentum and participation are concurrently weakening — building a stronger airtight case for a reversal or further correction.

The ICT trading approach — crafted by Michael Huddleston, aka The Inner Circle Trader—is all about grasping the moves of smart money in the marketplaces. Rather than blindly trading on indicators, ICT traders learn market structure, liquidity pools, and institutional order flow.
This methodology underlies Smart Money Concepts (SMC), where the trader attempts to align his or her entries with major financial institutions responsible for significant market direction.
ICT instructs that all movements of price are led by liquidity — i.e., where the stop orders and pending positions are stationed above or below highs and lows of the marketplace.
Under the ICT model, divergence trading is not employed alone but rather as a contextual verification of market inefficiency. Divergences between correlated assets or indicators indicate possible imbalances between the liquidity zones.
For example, when a new high is made by a price into a liquidity pool but momentum indicators (such as RSI or MACD) do not confirm it, it's a warning signal that smart money may be liquidating positions instead of fueling continuation. This is a component of the SMT divergence ICT trading setup where one of the correlated pairs makes a new high or low, while the other does not, revealing the underlying weakness in the move.
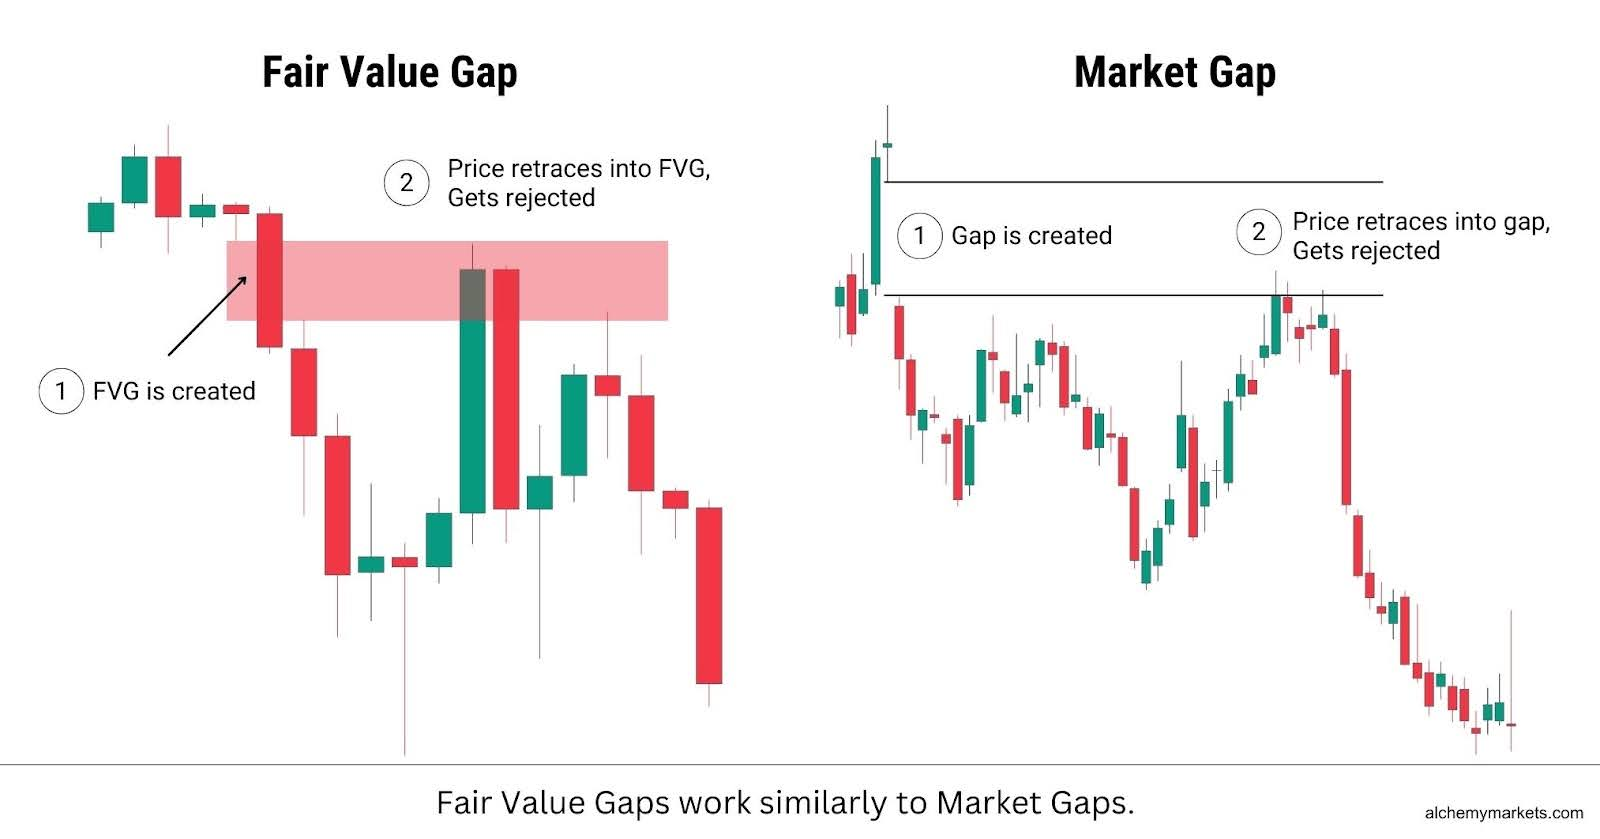
ICT traders frequently accompany divergence signals by Fair Value Gaps (FVGs), order blocks, and imbalance zones. If a divergence coincides with these structural locations, it verifies that a rebalancing of the price is imminent, indicating a higher-probability entry.
For instance, if volume divergence occurs by a premium FVG or institutional order block, it validates the signal that the liquidity has been cleansed, and a reversal is imminent.
SMT divergence is also called Smart Money Technique divergence. It's a principle of the ICT trading approach that measures two related possessions, like EUR/USD against GBP/USD in the foreign exchange or BTC against ETH in cryptos.
Unlike divergence by indicators, SMT deals solely with the behaviour of the price, announcing subtle institutional sentiment shifts. Suppose one correlated market rises to a new high or a new low, while the second doesn't respond correspondingly. In that case, it signals distribution or accumulation by the smart money — the big players responsible for the market's direction.
In normal conditions, related pairs generally trade in tandem. But when a breakdown in structure occurs for one asset and the second does not re-verify, it indicates a loss of correlation and a possible larger market imbalances.
For instance, if a new high for EUR/USD occurs while a previous high for GBP/USD remains unchanged, it indicates bearish SMT divergence, possibly meaning large traders are spreading positions as the uptrend falters.
If a lower low for BTC occurs but a lower for ETH occurs above its previous lower low, it indicates a bullish SMT divergence. It suggests stealthy accumulation and a possible reversal.
This divergence in alignment between correlated holdings frequently occurs shortly before significant turns, thus serving as a credible early warning of shifting institutional activity.
A compelling reading of SMT divergence involves analysing relative highs and lows and interpolating slopes between correlated instruments. A growing gap between their structures indicates which market is running ahead or falling behind — a signal of where institutional money is flowing.
For example, if BTC cleans liquidity below the support, but ETH doesn't, it indicates that sell-side liquidity is being absorbed by the market, which tends to lead to a reversal. ICT traders further seek confluence with order blocks, Fair Value Gaps (FVGs), or even volume divergence to narrow their entries.
SMT divergence gives depth to basic divergence trading by contrasting price structures rather than indicators. It clarifies the thinking of intelligent money and provides a multi-market verification that a move is real or deteriorating.
It alone is a compelling way to look for reversals and high-probability configurations in both crypto and FX markets when traded together with other ICT tools such as market structure shifts and liquidity zones.
Divergence applies to all markets but provides varied insights for each. On the FX market, it identifies shifts in momentum around liquidity nodes, while in cryptos, it identifies institutional trades based on price and volume actions.
When applied correctly in each space, it enables traders to optimise entries and become a more accurate overall trader.
Divergence in forex trading is particularly strong during high-liquidity events like the London open or the New York feed overlap. It's where the price tends to sweep away a previous high or a previous low to gather liquidity before making a reversal. It's when such a move coincides with typical RSI or MACD divergence that momentum is fading, even during a breakout.
For instance, if the EUR/USD is trading higher than the session high of the Asian session but the RSI makes a lower high, it indicates that the purchaser is weakening. The trader will then wait for a change in market structure—a breakdown of the previous pullback low—to authenticate a possible reversal.
A trade is typically taken on the initial retest of the break, using stops above the swept high and profit objectives near the session midpoint or the prior low. This system is most trustworthy when divergence manifests at a major help or resistance level or liquidity zone, offering structural confluence for the momentum signal.
Divergence is most reliable when used alone for market structure and liquidity mapping. Instead of trading all signals, experienced traders locate where the liquidity is most likely to be residing—at a previous high, a previous low, or a previous area of imbalance—and patiently await divergence to show up.
For example, a bearish divergence developing in a zone of premium near a prior order block or FVG indicates that intelligent money may be distributing. A bullish divergence in trading developing in a zone of discounting indicates presumable accumulation.
By combining divergence with these high-probability zones, the trader can filter out noise and focus on setups where liquidity is supported by a combination of structure and momentum.
On crypto markets, the SMT divergence—a key principle of ICT trading strategy—can uniquely reveal how institutions behave. At the onset of the divergence between two related coins like BTC and ETH, a change in smart money activity is indicated.
A classic setup happens when BTC establishes a lower low while ETH remains higher than its lower low. Bullish SMT divergence here indicates that the big guys are secretly buying while the retail traders are panicking. If such a setup also accompanies bullish RSI divergence and a recovery of a crucial level like the day's open or an FVG, it gives a firm foundation for a long trade.
With the same rationale worked in reverse for bearish SMT divergence, where one picks a new high, but the other does not confirm it, it often signals distribution ahead of a fall.
Cryptocurrency markets are intrinsically choppy, with regular liquidity raids and sudden reversals. Divergence serves to separate true strength in a trend from fleeting manipulation. If a new high is printed by the price but the volume or OBV doesn't accompany it, it's a sign of poor participation—a signal that the advance will temporarily vanish.
The most powerful configurations occur when divergence in volume is co-shaped by RSI or SMT divergence near major technical levels, such as the week's open, the prior day's high/low, or institutional order blocks.
During active markets, it's often better to trade small positions and use limit entries during retracements into recovered FVGs, keeping tight stops below the sweep or structural T/B.
Divergence trading is a high-requirement activity in terms of precision, swiftness, and the appropriate software — all that Atmexx aims to provide. The software has high-charting functionalities that enable easy and accurate reading of RSI, volume, and ICT/SMT divergences.

With rapid order execution, traders can respond immediately to formations that develop during times of high volatility, so opportunities are not lost. Atmexx also gives single access to both crypto and FX markets, so users can implement trading divergence techniques easily across various instruments.
By developing skills and confidence, traders may first train on demo accounts and then move to live trading, familiarising themselves from scratch with how ICT and SMT divergence concepts operate under real-time conditions.
With Atmexx, each trader has the tools and access to the markets required to develop divergence analysis into a reliable trading edge.
Divergence trading is less about prophecy and more about interpreting inequality ahead of the crowd's response. Whether it's regular, secret, or SMT divergence, these indicators indicate when momentum, liquidity, or institutional flow changes below the surface.
By integrating indicator-based and price-based divergence tools, traders may enter both crypto and FX markets all the more confidently, accurately, and consistently.
Ready to implement these strategies? See Advanced charting tools and real-time execution at Atmexx.com and elevate your divergence trading to a new level.
What is divergence trading in basic terms?
It occurs when price and an indicator move in opposite directions, signalling a possible slowdown or reversal in trend momentum.
How does ICT employ divergence?
The ICT trading plan uses divergence to identify inefficiencies around pools of liquidity or Fair Value Gaps and verifies potential turns or continuities.
What is SMT divergence?
SMT divergence contrasts related assets — such as EUR/USD versus GBP/USD or BTC versus ETH — to identify secret accumulation or distribution by wise money.
Is crypto trading volume divergence useful?
Yes. When price rises but volume drops, it often signals weak participation and a potential trend reversal.