
.svg)

Share
Open a cryptocurrency account and earn profits from digital currencies.

Related articles
Author
Constantine Blake
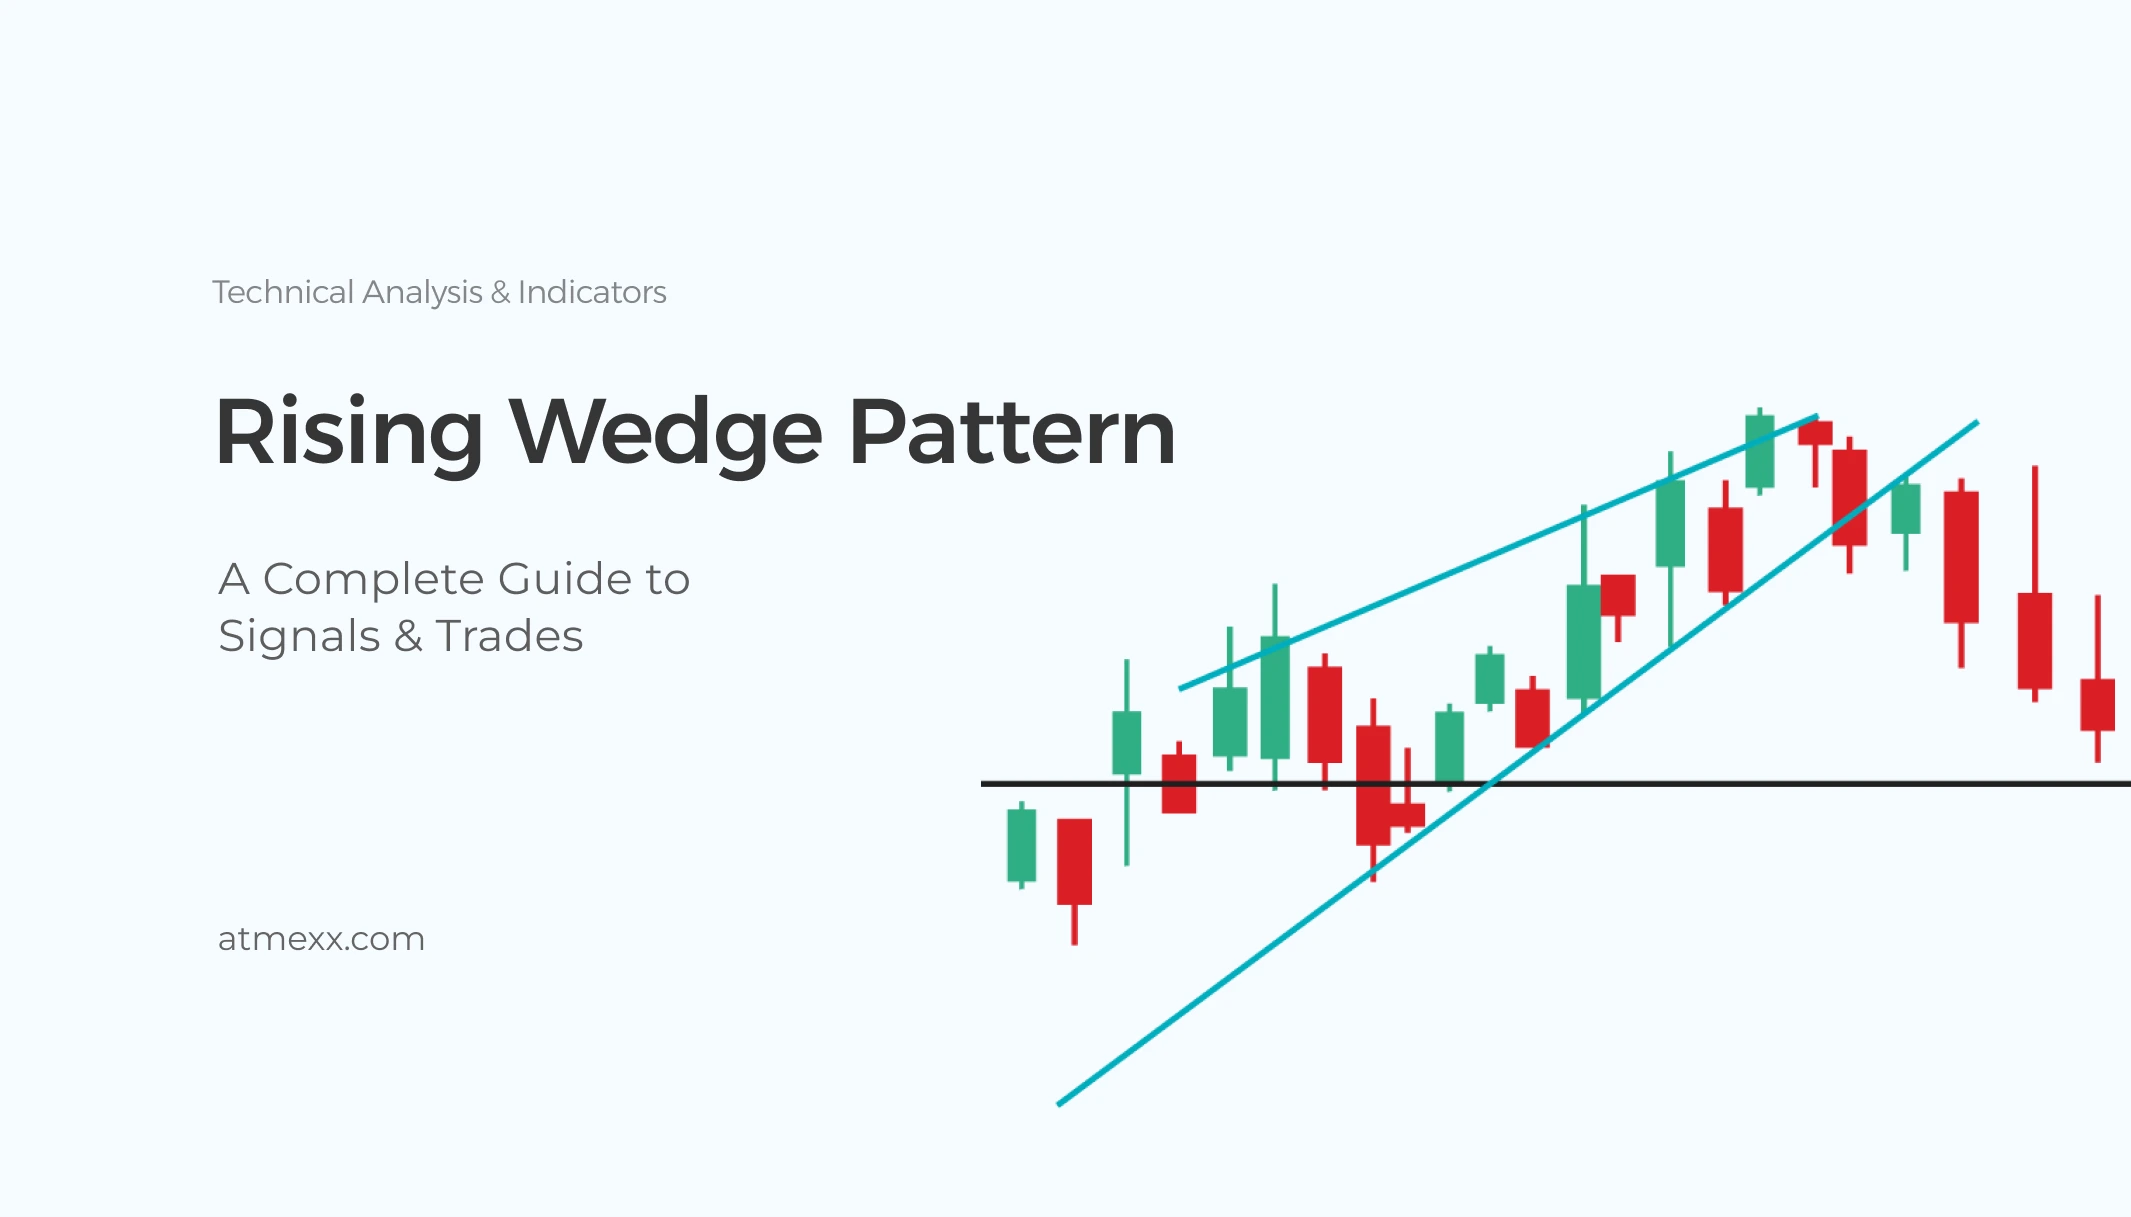
Chart patterns are the market’s secret language—when you learn to read them, you know what comes next. One most potent yet overlooked formation is the Rising Wedge formation. Initially, it appears bullish, prices driving higher, yet beneath the surface it betrays waning momentum and an imminent change.
As a beginner trader, mastering the setup entails learning to sidestep expensive bull traps and gaining the confidence to take trades with accuracy.
In this guide, we demystify everything you need to learn on identifying, verifying, and trading the Rising Wedge so that on platforms such as Atmexx, you may trade smarter.
The Rising Wedge chart formation indicates deteriorating bullish sentiment and tends to be a harbinger of a bearish reversal or pullback. Initially, it appears to be an uptrend: prices continue to rise, making higher highs and higher lows.
The angle of the lows and highs is not the same, though—the highs slope upward less than the lows, producing a wedge formation that tightens the closer the formation develops. This apparent tightening on the chart indicates an uneven balance among buyers and sellers.
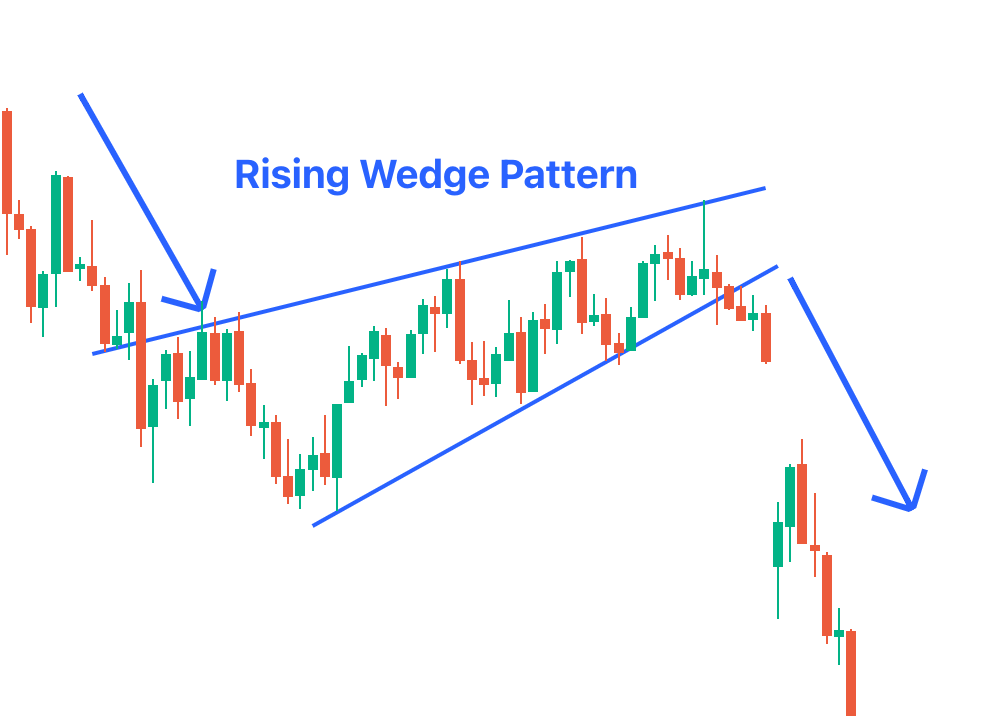
On a psychological level, the Rising Wedge shows the market is slipping away from the buyers. Each rally is less substantial than the last one, and the sellers begin to interfere sooner with increasing power.
The overall net result is the slow squeeze, where the brightening energy fades down until the support caves. When that penetration is made, the move tends to be swift on the heels of breaking down the late buyers into the phenomenon of the bull trap.
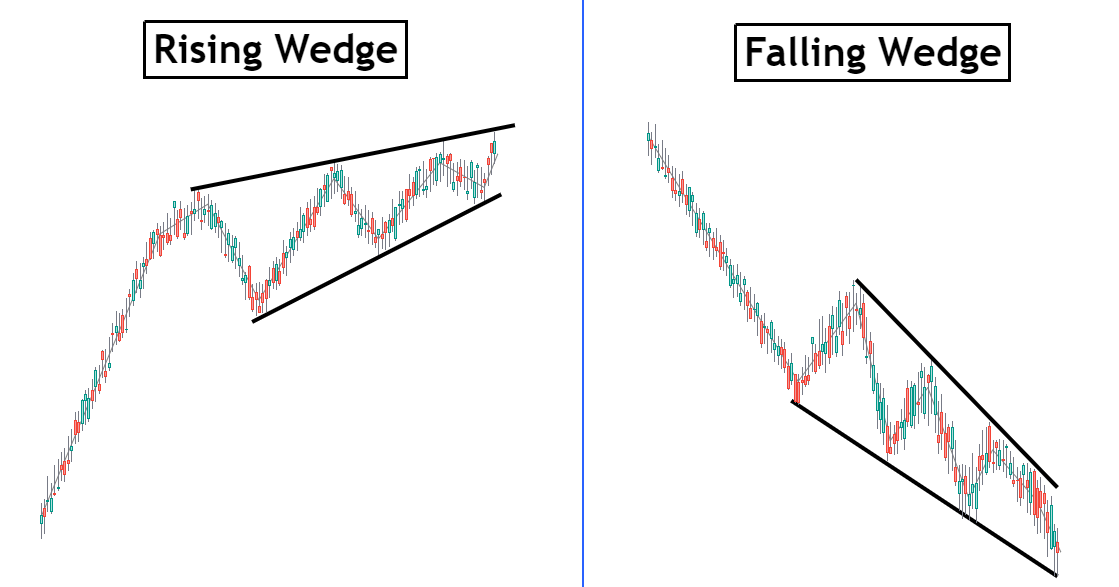
The Rising Wedge can come in two variations. As an uptrend reversal formation, it naturally suggests the trend is on the verge of reversing. As a downtrend continuation formation, it forms on a small corrective rally before the market resumes its decline.
Either way, the outcome tends to be bearish, hence making the Rising Wedge an extremely valuable risk management tool and trade timing gauge.
The Rising Wedge may appear under two general conditions: as a top reversal formation on an uptrend or a continuation formation on a corrective rally on a downtrend. This is significant since the trading approach varies depending on the position the wedge forms.
A Reversal Rising Wedge forms after an extended uptrend to indicate that the buying strength is losing steam. Initially, the chart appears strong with higher lows and higher highs, but every subsequent rally becomes progressively weaker. The trendlines move closer together, indicative of compression, whereas volume tends to fall to indicate slipping buying interest.
On an analytical level, this is an indication that the buyers are getting tired, and sellers are slowly entering the scene sooner with greater force. The development is typically solidified when the price breaks down below the lower trendline, on better volume. Traders tend to demand additional validation, e.g., bear candlestick clues or divergence on RSI or MACD.
For a trade, some prefer an aggressive entry on the first breakdown, while others wait on a retest of the broken support, which usually tends to provide new resistance.
Stops are kept above the top edge of the wedge or the retest top, profit targets being around the previous swing low or gauged by projecting the wedge height downwards.
Continuation Rising Wedge develops on the backdrop of a downtrend, typically on a short-lived corrective rally. Prices creep up the wedge, although the action isn’t conviction-driven.
As opposed to the reversal wedge, this rendition takes shape on the tail of an overriding bearish trend and is accordingly an interruption instead of an actual course correction.
The psychology is the same: buyers attempt to rally higher but cannot regain essential resistance levels, and the upside structure appears rickety. Volume typically diminishes on the wedge, later blowing out on the breakdown as sellers re-establish dominance. Confirmation tends to materialise when the lower trendline breaks, and this time the move occurs on the larger downtrend.
Traders who recognise a continuation wedge would typically continue the overall bearish trend. Traders would take trades on the initial breakdown or on a retest of the broken support.
The risk is found in entering stops above the corrective rally highs, and the profit targets would be the early lows or extensions based on the size of the wedge.
The Rising Wedge is one of the most recognisable bearish chart patterns, and its strength lies in its concrete structure. To correctly identify it, traders focus on several distinct characteristics that separate it from a normal uptrend.
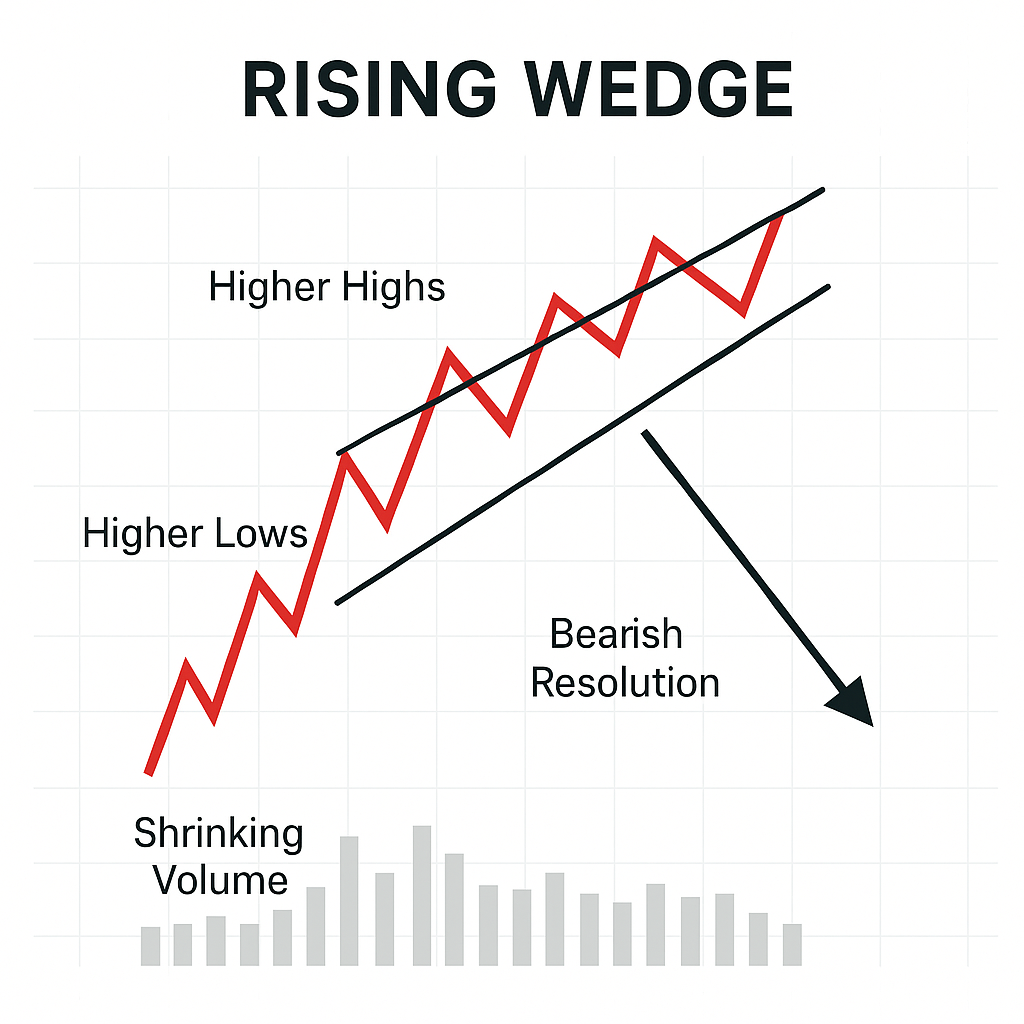
At first glance, the market looks bullish because prices continue to rise. However, the pace of these moves tells a different story. Each new higher high is smaller and weaker compared to the previous one, while the higher lows rise more steeply. This imbalance creates a wedge that points upward, but with clear signs of slowing momentum.
When the sequence on the highs is added to the sequence on the lows by joining it with two consecutive straight lines, both the trendlines rise but begin to converge towards each other. The gap between the two is decreasing, a sign of indecision and gradually diminishing buying power. This is the visual compression that constitutes the nucleus of the pattern.
Volume typically decreases when the wedge is being constructed. In a typical uptrend, rising prices should be supported by strong buying. But when dealing with a Rising Wedge, volume decreases when prices rally, showing progressively fewer investors become interested in holding the higher ground. That lack of interest makes the uptrend weak and prone to breaking.
Although the slope of the pattern is upward, the forecasted result is bearish. The Rising Wedge typically concludes with a clear-cut move down below the lower trendline, which often precipitates a swift decline. The greater the angle of the lower trendline and the abrupt the breakdown, the better the bearish signal tends to be.
Rising Wedges may appear on any time scale, ranging from the intraday chart to the weekly setup. On smaller timeframes, they tend to signal short-term pullback threats, whereas on larger timeframes, they may signal large-scale trend reversals. Notwithstanding scale, the underlying indications remain the same.
The rising wedge chart pattern is a powerful signal in technical analysis, and knowing how to trade it correctly can help beginners avoid costly mistakes while spotting high-probability opportunities.
Here are three simple yet efficient trading strategies which perform well when this formation shows up on your charts.
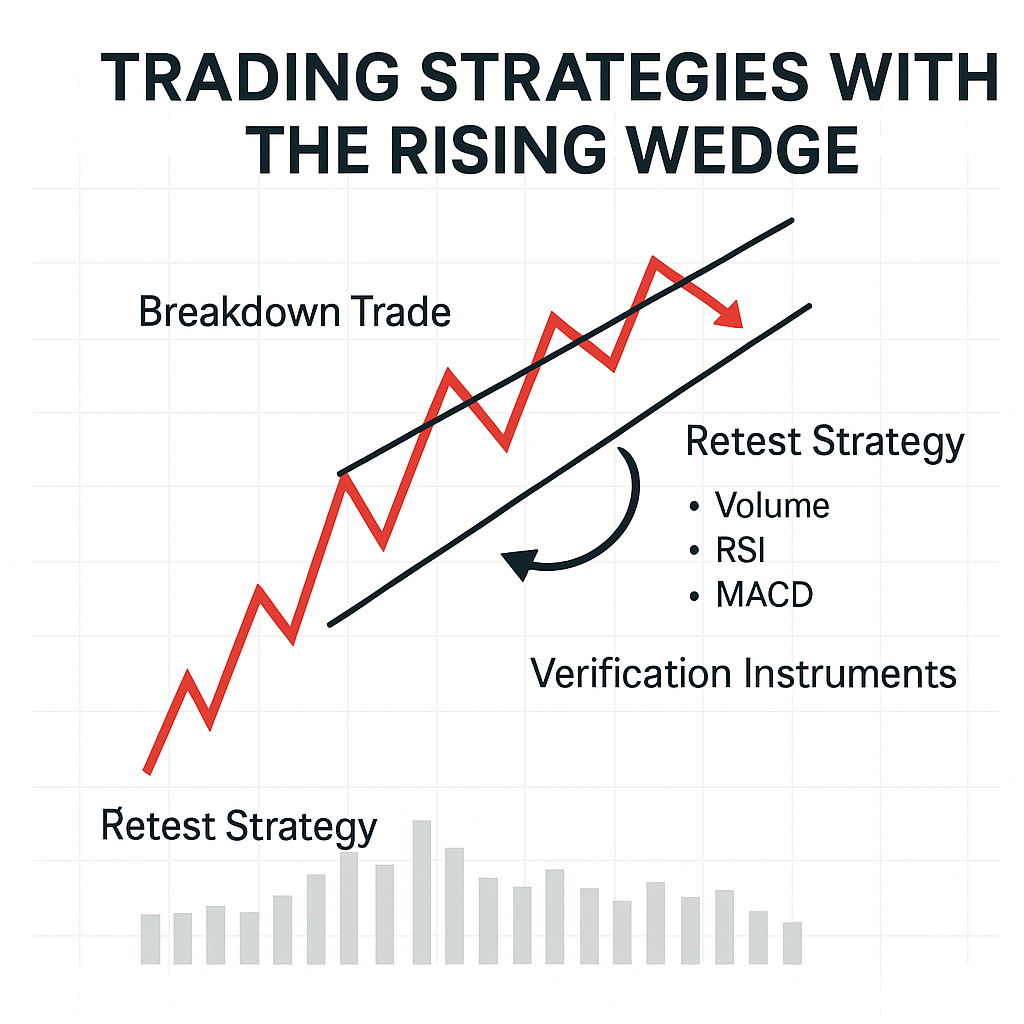
The most typical entry method on the rising wedge chart formation is when the price penetrates the low support line. This is the time when the buyers ultimately lose the battle, and the sellers come on top.
Traders confirm by waiting for a solid bearish candlestick formation on the breakdown, e.g., an engulfing candle or long red candlestick, accompanied by rising volume.
Newcomers should refrain from making early entries and instead wait for strong evidence that the breakdown is real and not merely a throwback.
This is the safer strategy: wait for the retest. Upon failure, the price tends to retest the broken line of support as the new resistance. This is one of the safest points to re-enter since the trader comes into the move at less risk and greater confirmation.
In the formation, the orders for the stop-loss may be placed just above the level of the retest, providing the perfect risk-to-reward ratio. This is an excellent method among beginner trading strategies since it does not bring emotional distress due to chasing the first failure candle.
To increase accuracy, traders often combine the wedge setup with the best indicators for day trading. For example:
When the technical indicators come into alignment on the wedge formation, the trader may trade with significantly greater confidence.
Begin with the universal process. Look for an up-move or corrective rally where the price forms higher lows and higher highs, but the highs top out. Plot an upper trendline that just touches two (preferably three) swing highs and a lower trendline joining two swing lows with a steeper incline.
You need apparent convergence—the two lines converging over the passage of time. As the wedge forms, volume should typically decrease, and the momentum indicators, such as RSI, normally indicate divergence (price up, RSI down).
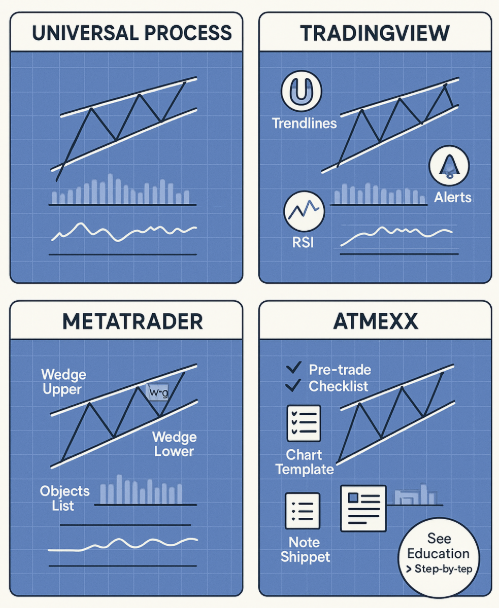
Be consistent on whether you anchor on the wicks or on the candle bodies, and remain consistent with the same decision on both the trendlines. The formation is “actionable” only when there are multiple touches and apparent narrowing.
On TradingView, activate Magnet Mode to snap the anchors to the swing points, then turn on the two rising, converging trendlines. Back up one step to confirm that you're not forming a rising channel—channels are made of parallel lines, wedges converge.
Save the chart configuration as a template so that your volume pane, RSI, and favourite EMAs appear automatically the next time. Create an alert on the bottom wedge trendline (right-click on it) on trendline cross; choose "Once per bar close" to reduce noise and add a small buffer (e.g., a few ticks or an ATR fragment) in the comments so that you'll confirm the break on a solid close.
Create separate alerts on RSI breaking below 50 or on a volume spike (e.g., volume larger than its average) so that you get tiered confirmation. If you watch many markets, add prospects to a watchlist and practice identifying good vs. spurious wedges using the Bar Replay tool—this engenders an intuition about the appearance of a clean break.
Use the Trendline object in MetaTrader to join swing lows and swing highs, and label each line (e.g., "Wedge Upper," "Wedge Lower") so that you may handle them individually from the Objects List.
MT's built-in alerts are most effective for price levels, so the easiest method is to add a horizontal line just below the wedge's low edge where a strong upside breakout would confirm the formation, then alert on that line. Suppose you wish to allow only strict trendline-cross breaks.
Try a lightweight custom indicator/EAs that alerts when the price penetrates a particular object. In that case, this is done by many technicians to prevent excessive screen staring.
Create an editable template (RSI 14, MACD, volume/OBV, your favourite EMAs) and bookmark it so every chart opens wedge-ready. Just like on any platform, confirm the break on a candle close rather than an intra-bar spike.
Use the Education section to standardise your wedge routine when trading on Atmexx: a concise pre-trade checklist (touch count, convergence, volume contraction, divergence on the momentum, higher-timeframe context) prevents you from classic mistakes like forcing lines or trading on unsound patterns.
Store a cached chart template that brings volume, RSI, and the beloved MAs on the board, and keep a concise note snippet that will be pasted into the trade journal: "Rising wedge; touches: 3/3; volume: contracting; RSI: bearish div; entry rule: close below the lesser TL + retest; stop: above retest top; target: prevous swing low/heigth projection."
Finish the portion with an overt CTA asking the reader to refer to instruments and study materials on Atmexx step by step so they can replicate the workflow.
The Rising Wedge may look like a simple upward climb, but in reality, it’s a warning sign that momentum is cracking. By learning how to recognize its structure, apply effective strategies like breakdown trades and retests, and confirm with reliable indicators, you turn a potential trap into an opportunity.
Whether you’re practicing on TradingView, working with MetaTrader, or using the powerful resources at Atmexx, the key is consistency, discipline, and context. Master this pattern, and you’ll add one of the most valuable risk-management tools to your trading arsenal.
Is a Rising Wedge bullish or bearish?
A Rising Wedge is considered a bearish pattern, even though prices climb during its formation.
How would you most safely trade a Rising Wedge?
Most speculators wait for a proven breakthrough and retest before shorting.
Which indicators perform best on Rising Wedges?
Volume, RSI, and MACD are the most effective for confirming weakening momentum.
Can Rising Wedges appear on all timeframes?
Yes, they can form on intraday, daily, or even weekly charts—the signals remain the same.