
Financial Market (Part 4)
Understand the basics with our interactive market course.
Understanding Price Charts
- Line Chart
- Bar Chart
- Japanese Candlestick Chart
On Atmexx trading platforms, all charts are created using only the bid price (the price at which you Sell). If you want to see the ask price (the price at which you Buy), it’s shown as a horizontal line on the chart.
Line Chart
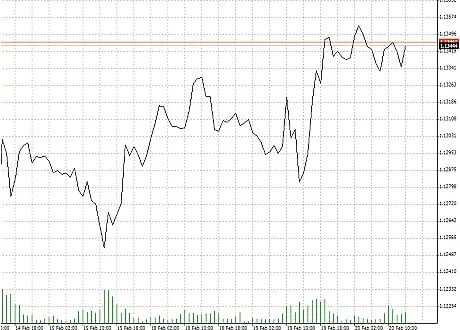
This chart type is the simplest to read, making it ideal for beginner traders. It shows only the closing prices for each selected time period (such as 1 minute, 1 hour, etc.), which are then connected by a continuous line.
But when it comes to detailed analysis, it’s not enough to just know if the price is going up or down. For this reason, line charts are best suited for a quick overview, not for in-depth trading decisions.
Example of a line chart for EUR/USD on the next card.
Bar Chart
This kind of chart gives more detailed information about how prices move. For each selected time frame, it displays the following information:
- Opening price
- Closing price
- Highest price
- Lowest price
On your trading platform, these values are often listed as O-H-L-C, which stands for Open, High, Low, and Close BID prices within that period.
Take a look at the example of the EUR/USD bar chart shown on the right.
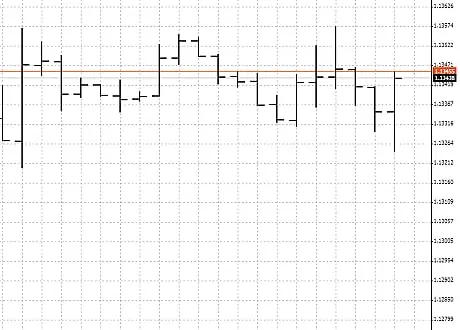
Bar Chart
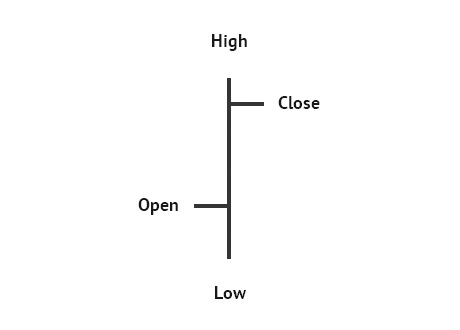
The shown bar chart includes a vertical line with two small horizontal lines—one at the top right and one at the bottom left.
The left horizontal line represents the opening price of the asset, while the right horizontal line shows the closing price.
The vertical line itself displays the full price range during the selected time period (such as 1 minute, 1 hour, or 1 day). The bottom of the line marks the lowest price reached, and the top marks the highest price during that period.
Although bar charts provide a lot of useful information, they are not as visually clear as candlestick charts, which we’ll look at next.
Japanese Candlesticks
Candlestick charts were first created by rice traders in Japan during the 19th century to show profit and loss. Today this chart type is one of the most widely used by traders and analysts because it clearly displays complete market data for each time frame in an easy-to-read format.
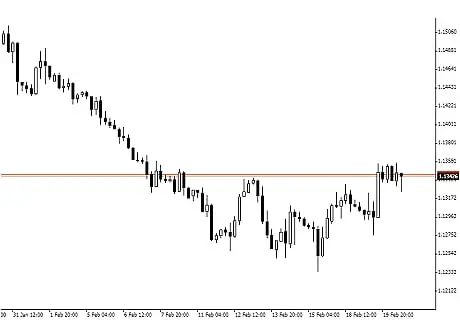
Below is an example of EUR/USD candlesticks.
Each candlestick represents a specific time period selected by the trader. For instance, you can view price movements by the minute (M1), or in 5, 15, or 30-minute intervals (M5, M15, M30), as well as by the hour (H1), every 4 hours (H4), daily (D1), weekly (W1), or monthly (MN). Some platforms may also provide additional time frame options.
One candlestick = one time period.
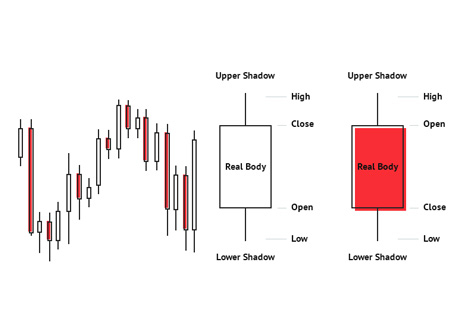
Candlestick Structure
Each candlestick is made up of a “body,” which is formed between the opening and closing prices of the selected time period.
When the price goes up during the period, the candlestick’s body has the opening price at the bottom and the closing price at the top, typically shown in green or filled.
On the other hand, if the price falls, the opening price stands at the top and the closing price at the bottom. This type of candlestick is commonly shown as red or unfilled.
Keep in mind that chart colors can be customized based on your personal preferences, and color schemes may vary depending on the platform.
Extending above and below the candle, the vertical line is called the “wick” or “shadow”, which displays the maximum and minimum prices for that time frame.
Here’s a quick recap of the chart types you can find on your trading platform:
- O-H-L-C stands for Open, Highest, Lowest, and Closing prices within the selected time frame.
- Charts are constructed using only the ‘bid’ prices; the current ‘ask’ price can be shown as a horizontal line on the chart.
- Line charts are the simplest type, showing just the closing prices.
- Bar charts provide complete information for the chosen period.
- Candlestick charts are the most common and easiest to interpret, presenting full period data visually.
- Each candle consists of a ‘Body’ (representing the open and close prices) and ‘Wicks’ (indicating the high and low prices).


.svg)