
.svg)

Share
Open a cryptocurrency account and earn profits from digital currencies.

Related articles
Author
Constantin Blake
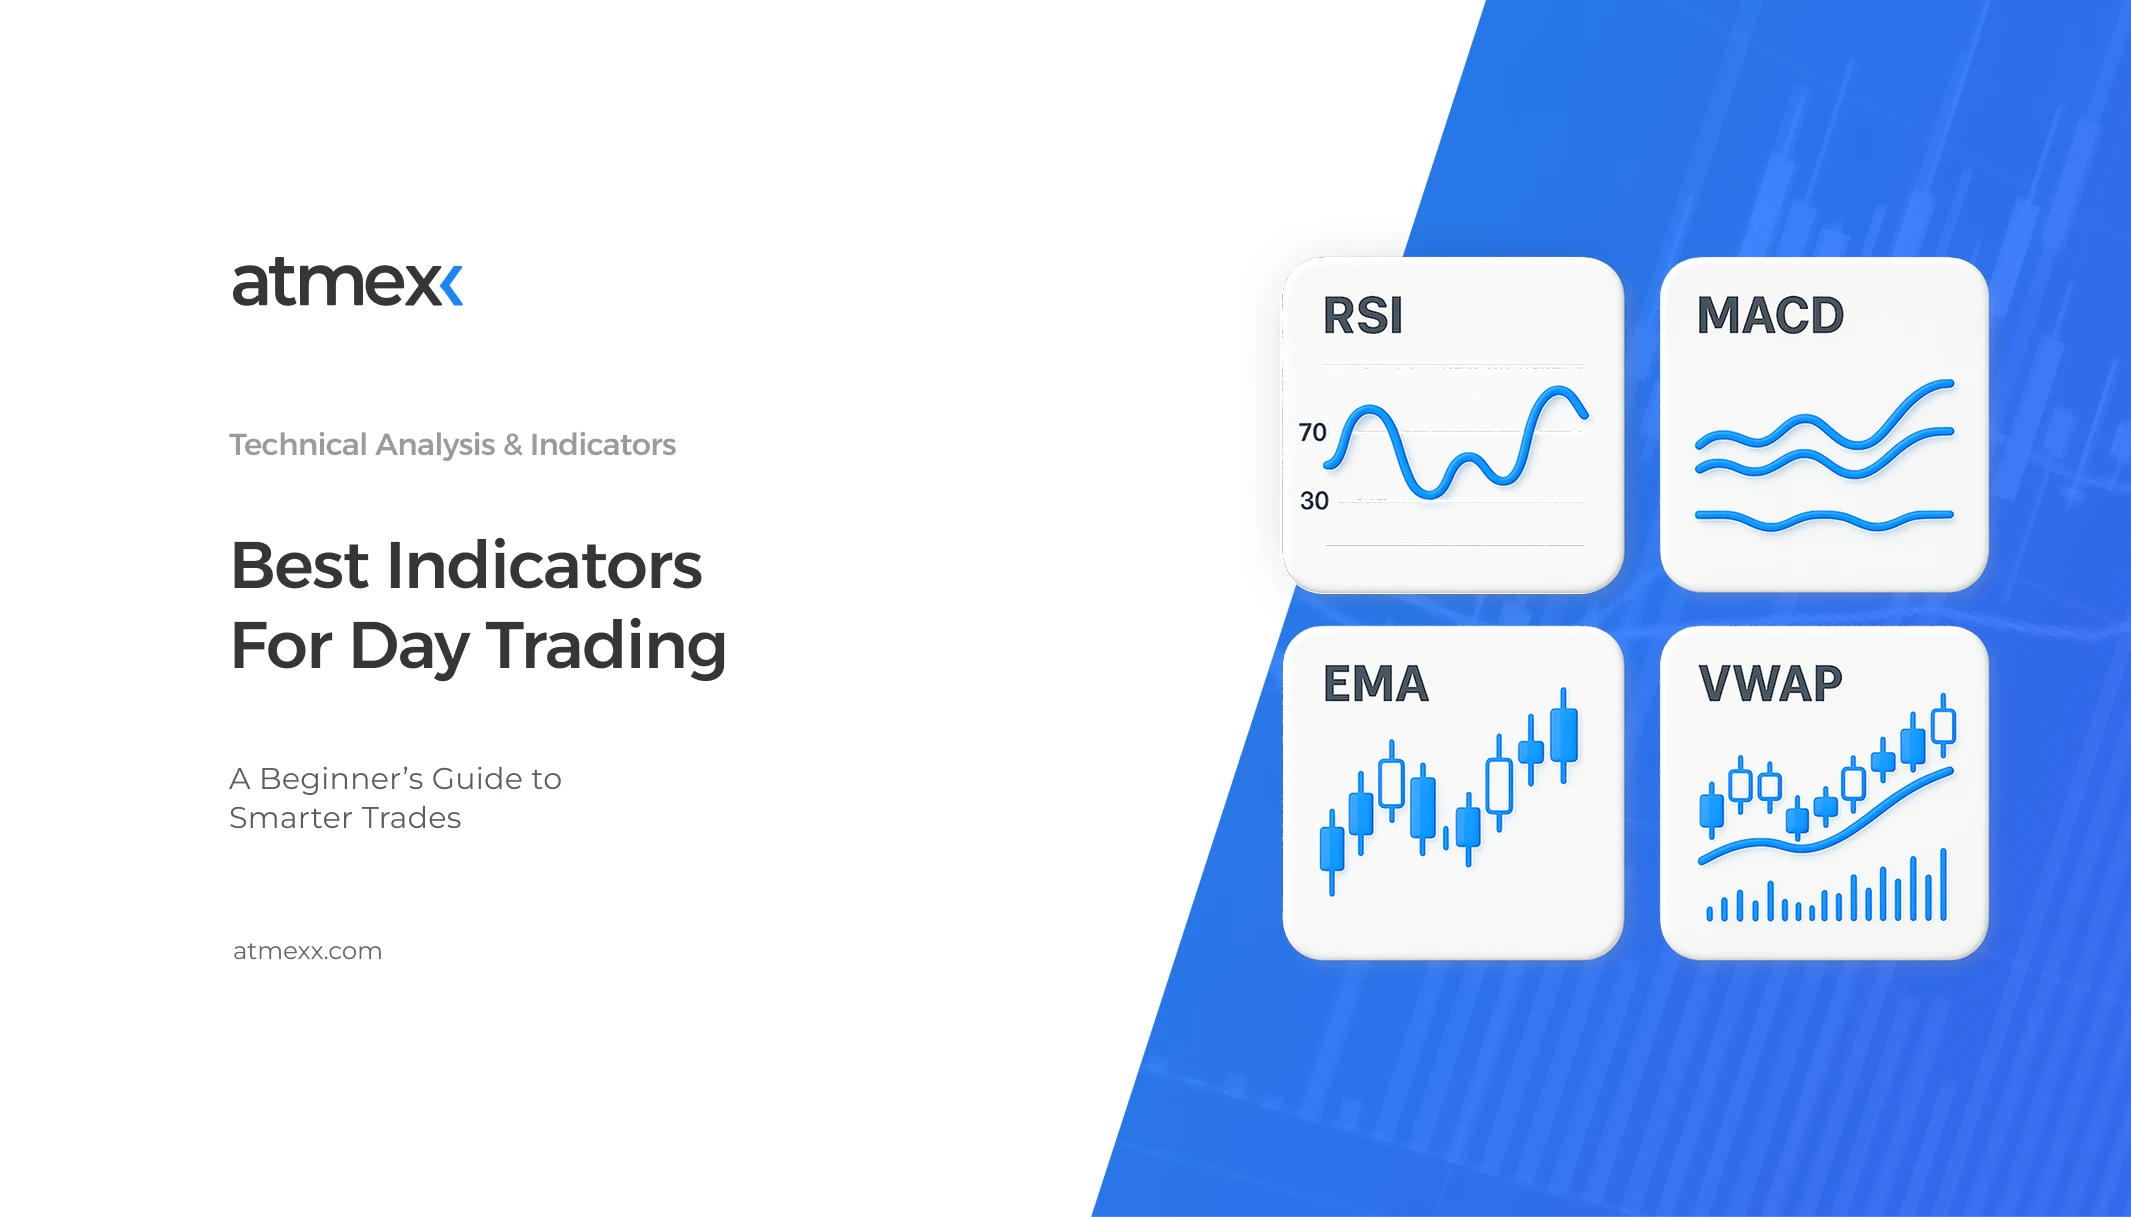
Day trading can feel like stepping into a high-speed chess match — where every move counts and every second matters. In this fast-paced environment, guessing won’t cut it.
That’s where technical indicators come in. They’re not cheat codes, but they can be powerful tools that help you make smarter, faster, and more confident decisions.
In this guide, we’ll break down the best day trading indicators for beginners — what they do, how they work, and how to actually use them without drowning in noise.
Day trading indicators are tools used by traders to analyse and interpret fast-moving markets. At their core, these indicators are mathematical calculations based on price, volume, or open interest.
They help traders identify patterns, predict short-term price movements, and make more informed decisions within a single trading day. Since day trading involves buying and selling assets within hours — or even minutes — having quick and reliable insights is crucial.
Unlike long-term investors who rely on company fundamentals or economic trends, day traders focus almost entirely on technical analysis. This is where indicators come in. They don’t tell the future, but they offer clues — like when a stock might be overbought, when momentum is fading, or when a breakout could be on the horizon.
There are two main types of indicators: leading and lagging. Leading indicators attempt to forecast future price movements. They’re especially useful for spotting potential reversals before they happen.
Lagging indicators, on the other hand, follow price trends and are best for confirming momentum or trend direction. Both types have their place in a day trader’s toolkit, and knowing when to use each is key to smart, timely decisions.
The most important thing to understand about trading indicators is that none of them are perfect. They work best when used in conjunction with a strategy rather than in isolation.
Many successful traders combine two or three complementary indicators to reduce false signals and boost confidence in their trades. Think of them not as magic formulas, but as tools to help you see the market more clearly — like turning on the headlights during foggy weather.
When you're just starting out in day trading, understanding which indicators actually help — and how to use them — is half the battle. Below, we break down the most popular and beginner-friendly tools, explaining not only what they do but also how they can be part of a smarter trading strategy.
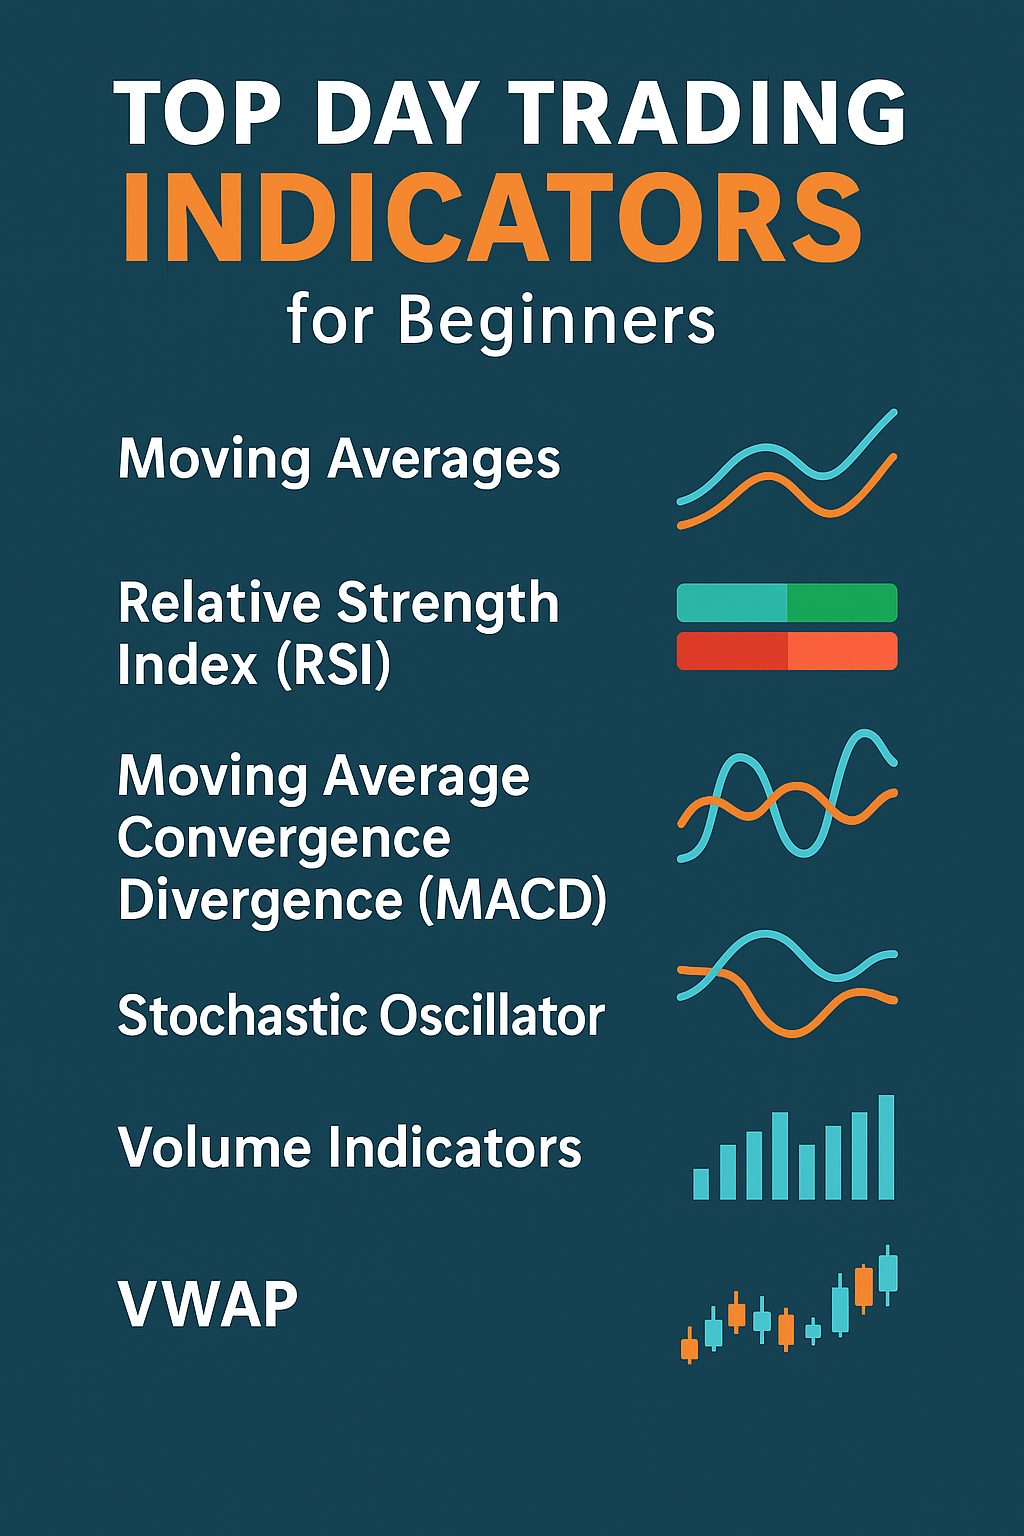
Day traders employ moving averages as simple tools to smooth the action in prices as well as to reveal the underlying trend. The two most common forms are the simple moving average (SMA), which accepts the average price over a chosen number of periods, and the exponential moving average (EMA), which places higher weights on recent prices, reacting more quickly to moving prices.
One of the greatest applications traders have with moving averages is through the use of the crossover strategies. For instance, the case where the short-term EMA moves above the long-term EMA can be an indicator the uptrend is starting – the time to go long. The reverse can confirm the downtrend is forming.
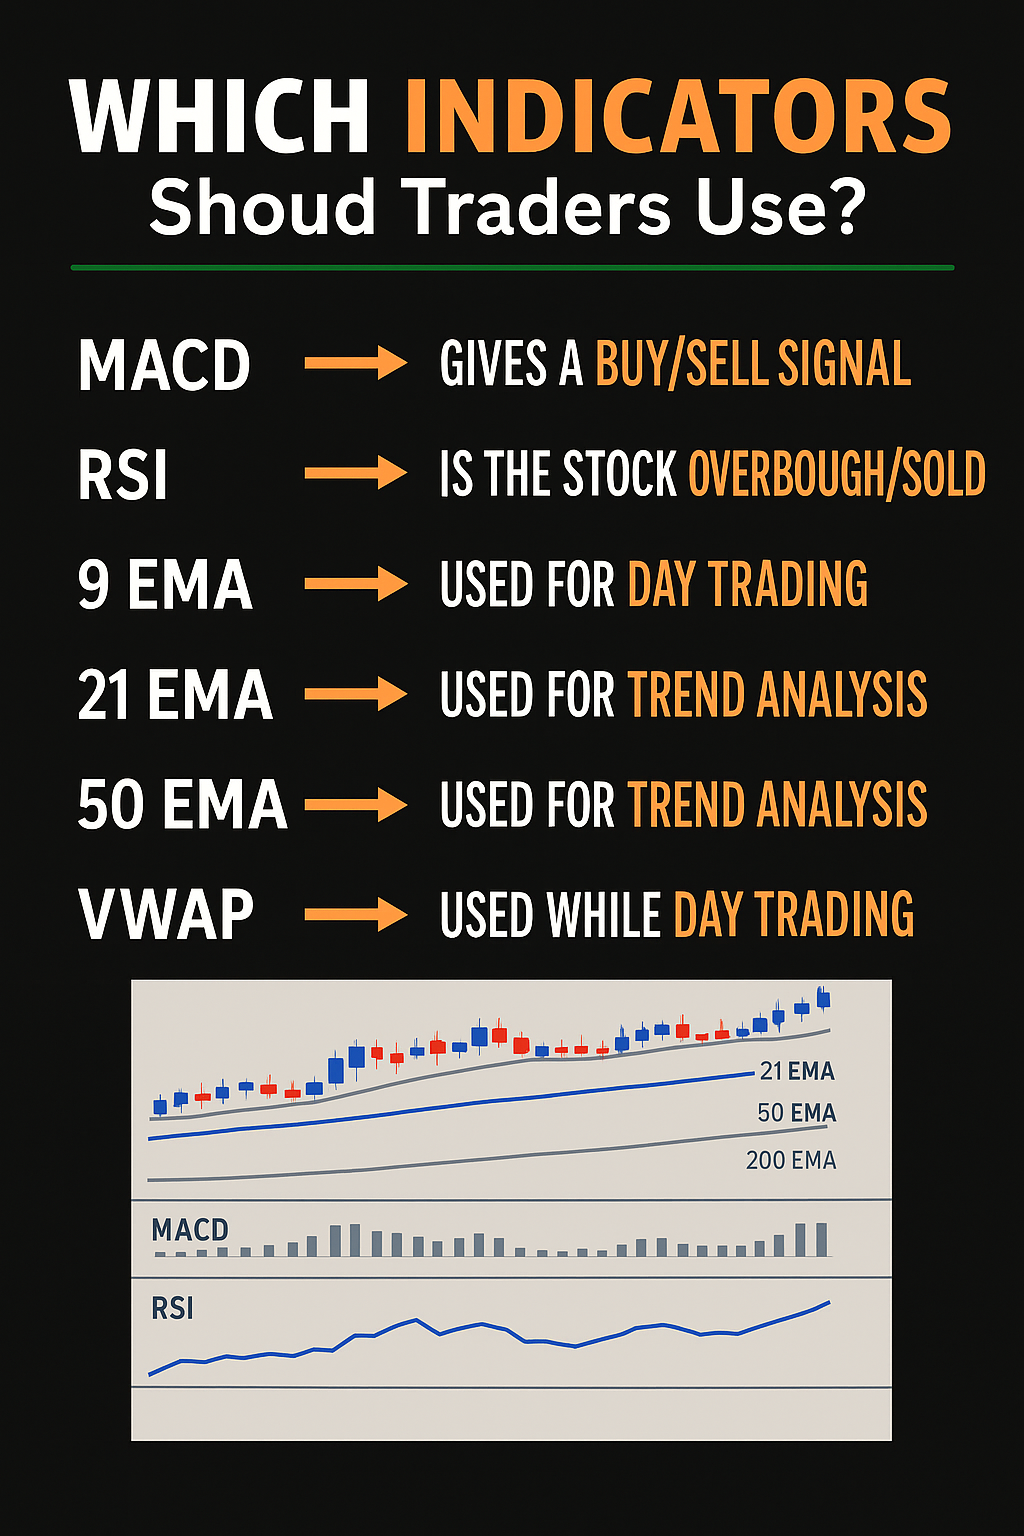
RSI is utilized as a measure of market pressure, gauging whether an asset is in an overbought or oversold state. It is scaled from 0 to 100, with readings higher than 70 representing overbought levels, while under 30 is indicative of oversold levels.
What distinguishes RSI is its ability to reveal hidden strengths or weaknesses through divergence. If the stock continues to rise in price, while the RSI begins falling, it may indicate the momentum is losing steam — an early warning sign of possible reversal.
MACD is a momentum indicator which employs two moving averages to detect changes in trend strength. When the MACD line crosses the signal line upwards, it is usually regarded as a bullish indicator. When it falls below, it could indicate weakening trend.
The histogram, which is the visual indicator of the difference between the MACD and its signal line, also introduces an additional layer — the ability to quickly determine momentum. The MACD is particularly effective to use in combination with other technical indicators, like the RSI, to corroborate trends.
Bollinger Bands encase the price chart in an adaptive envelope which spreads and tightens as it reacts to market volatility. Prices trading in the upper band can signify strength or overbought levels. When prices graze the lower band, it can imply weakening or oversold levels.
These bands also work well to identify breakout chances. Squeeze is usually tight where explosive moves take shape, so these bands can be used to predict volatility even before it arrives.
This momentum gauge measures the current price against its range in the recent time frame, offering insight into whether or not a share is heading towards its turning point. There are two forms it can take — fast or slow — with the former offering faster movement but less precision than the latter.
In comparison to the RSI, which monitors the strength of recent trends, the stochastic oscillator is concerned with the position of the current price against its historic tops and troughs. This is especially useful in the identification of temporary reversals during sideways markets.
Volume indicates the conviction behind the price moves. If prices are moving higher but the volume is light, the move may lack conviction. The on-balance volume (OBV) either adds or deducts the volume depending upon the direction of the prices, giving the traders an idea of whether the buyers or the sellers are taking control.
Volume moving averages, in the meantime, assist in identifying spikes which can validate breakouts or predict reversals. Observing the way volume reacts at significant levels can be the difference between trading successfully or receiving misleading signals.
VWAP acts like a magnetic line on your intraday chart — showing the average price a stock has traded at throughout the day, weighted by volume. It's a favorite tool among institutional traders and day traders alike.
If the price is consistently above VWAP, it often means buyers are in charge. If it's below, sellers may have the upper hand. For traders seeking mean reversion opportunities or dynamic support and resistance, VWAP is a go-to indicator.
When getting into day trading, many new traders soon face one universal obstacle: too many options. With so many technical analysis tools and signals claiming to enhance your profits, it is hard to determine what really works.
Choosing the best technical indicators for day trading depends on your style, the chart timeframe you use, and how well you manage indicator clutter.
The effectiveness of stock indicators varies based on the chart timeframe. If you're trading using 1-minute or 5-minute charts, you're making lightning-fast decisions.
Within these timeframes, trading indicators such as the Exponential Moving Average (EMA) or VWAP are your best friends. They respond quickly to price shifts and help you catch momentum before it fades.
On 15-minute or longer intraday charts, you have more time to analyze the setup. Here, broader technical indicators, such as the Relative Strength Index (RSI) or MACD, become more reliable.
These are especially useful when you're looking for clearer trends or waiting for confirmation before entering a trade.
Your trading style is another consideration in choosing the best stock market indicators. Scalpers who enter many trades during the day and close them in minutes depend considerably on technicals reacting fast. They can use the stochastic oscillator, EMA crossovers, or VWAP to time their entries and exits accurately.
If you opt to engage in intraday swing trading, keeping positions from 30 minutes to a few hours, you will require a slower, smoother perspective. Stock market indications like the Bollinger Bands, the MACD, and the RSI help you detect lasting trends, judge market strength, as well as staying away from getting in too soon or too late.
A common mistake among new traders is attempting to use every indicator simultaneously. But more doesn't mean better. In fact, too many technical indicators can clutter your screen, leading to decision paralysis. What are the indicators you actually need?
Stick to the 2–3 rule. Use no more than two or three stock indicators at a time — each serving a different purpose. A solid combination might include a trend indicator (such as the EMA), a momentum indicator (like the RSI), and a volume-based tool (like OBV). Together, they give a well-rounded view of price action without overwhelming your analysis.
Combining Indicators for Better Accuracy
In day trading, using one indicator in isolation oftentimes equates to shallow analysis and dangerous conclusions. It is for this reason many experienced traders employ several technical indicators to eliminate misleading signals and achieve a better understanding of the market. Applied with consideration, this strategy can greatly improve your accuracy in trading.
The RSI + EMA + MACD Strategy
One such highly regarded, well-balanced combination is the incorporation of the relative strength index (RSI), the exponential moving average (EMA), and the moving average convergence divergence (MACD).
Each has a distinct role to play in your trading setup, which ensures the strategy is robust. RSI is an oscillator used to detect overbought or oversold levels, which is particularly valuable to identify potential turning points.
EMA, meanwhile, monitors the trend in the price with higher sensitivity to recent activity, allowing you to determine the direction the market will move in the short term. MACD indicates momentum as well as the strength of the trend, giving you an idea whether the trend will persist or die away.
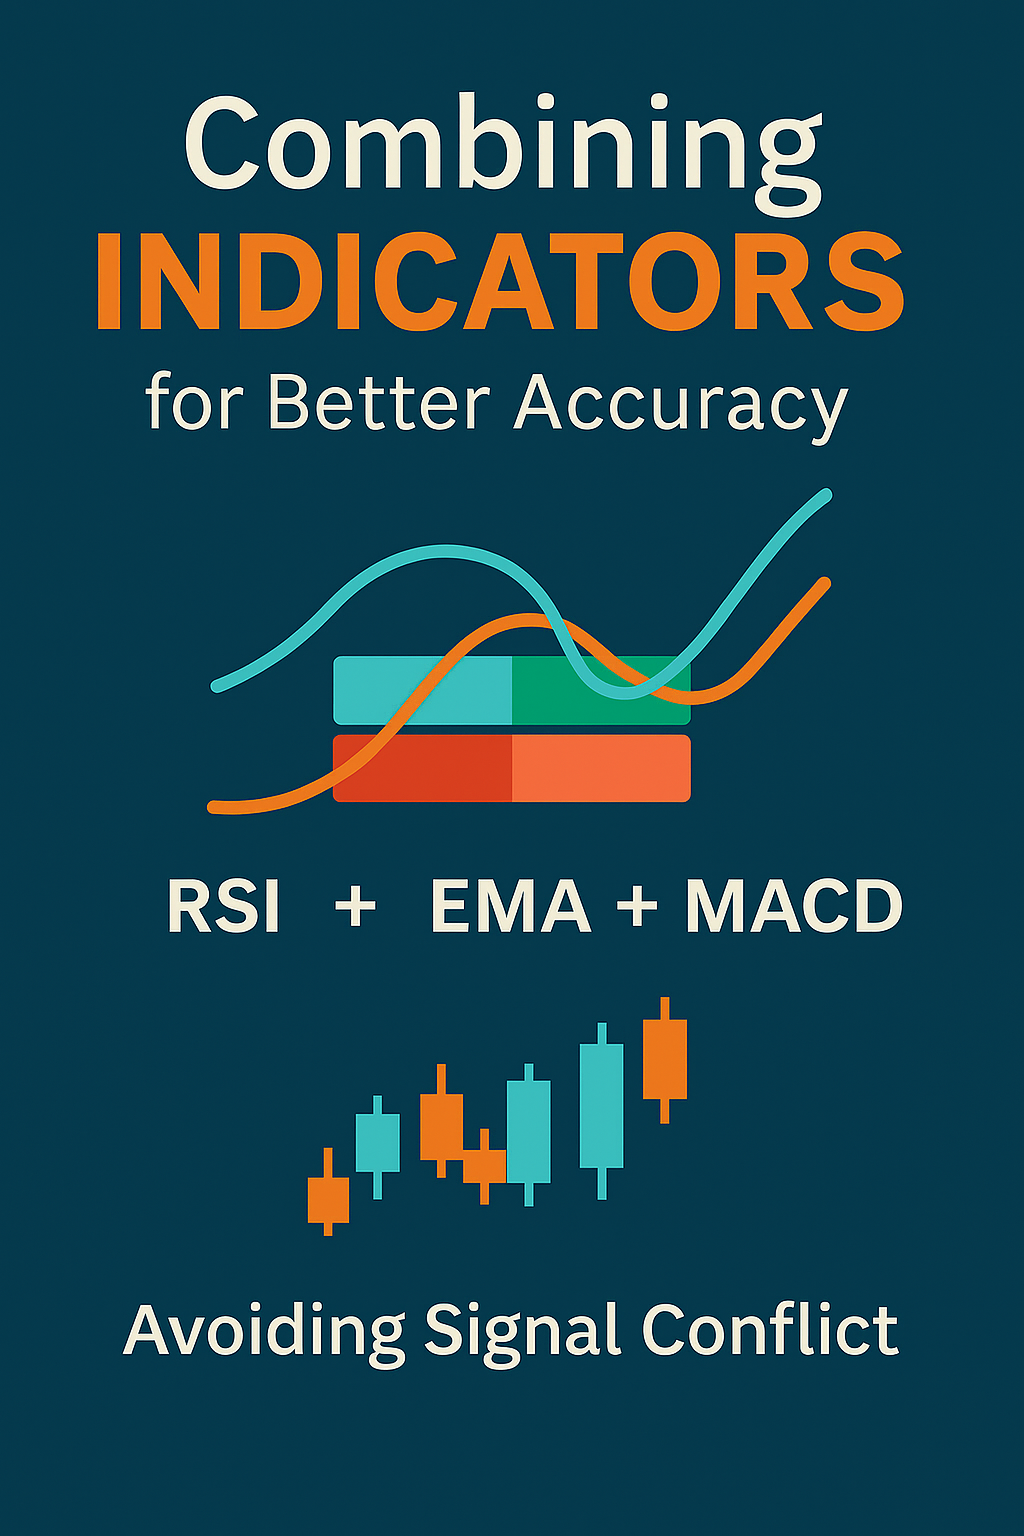
Together, these three indicators create a layered strategy. For instance, if the RSI indicates that an asset is oversold, the EMA confirms that the price is turning upward. MACD crosses into bullish territory; this confluence of signals provides a stronger case for entering a long position than any of the indicators would on their own.
Avoiding Signal Conflict
Still, using several indicators can sometimes create conflict in signals — particularly where the signals conflict in purpose. For instance, combining RSI with the Stochastic Oscillator is unlikely to bring much value to the table, since both are momentum gauges with the potential to convey conflicting messages.
Rather, it is preferable to use tools that reinforce one another where insights do not duplicate. The objective is to achieve equilibrium. An effective way to do that is to select one trend-tracking indicator, one momentum indicator, and one tool based on volume. This offers a broader market view without cluttering your chart or thought process.
Backtesting and Validation Tips
Before using any indicator combination in a live environment, it's crucial to backtest the strategy. Backtesting involves applying your setup to historical price data to evaluate how it would have performed under different market conditions. Most modern trading platforms offer this feature.
Focus not just on the number of wins the strategy produces but also on its consistency, drawdowns, and how well it adapts to various market environments.
Once you're satisfied with the results, move to paper trading. This allows you to test the system in real-time with no financial risk, allowing you to make adjustments based on real-world performance.
When you’re just starting out in day trading, technical indicators can feel like magic tools — simple formulas that seem to predict price movements with just a glance.
But that illusion can quickly break down if you don’t use them properly. Many new traders make the same avoidable mistakes when it comes to indicators, and these missteps often lead to frustration, losses, or both.
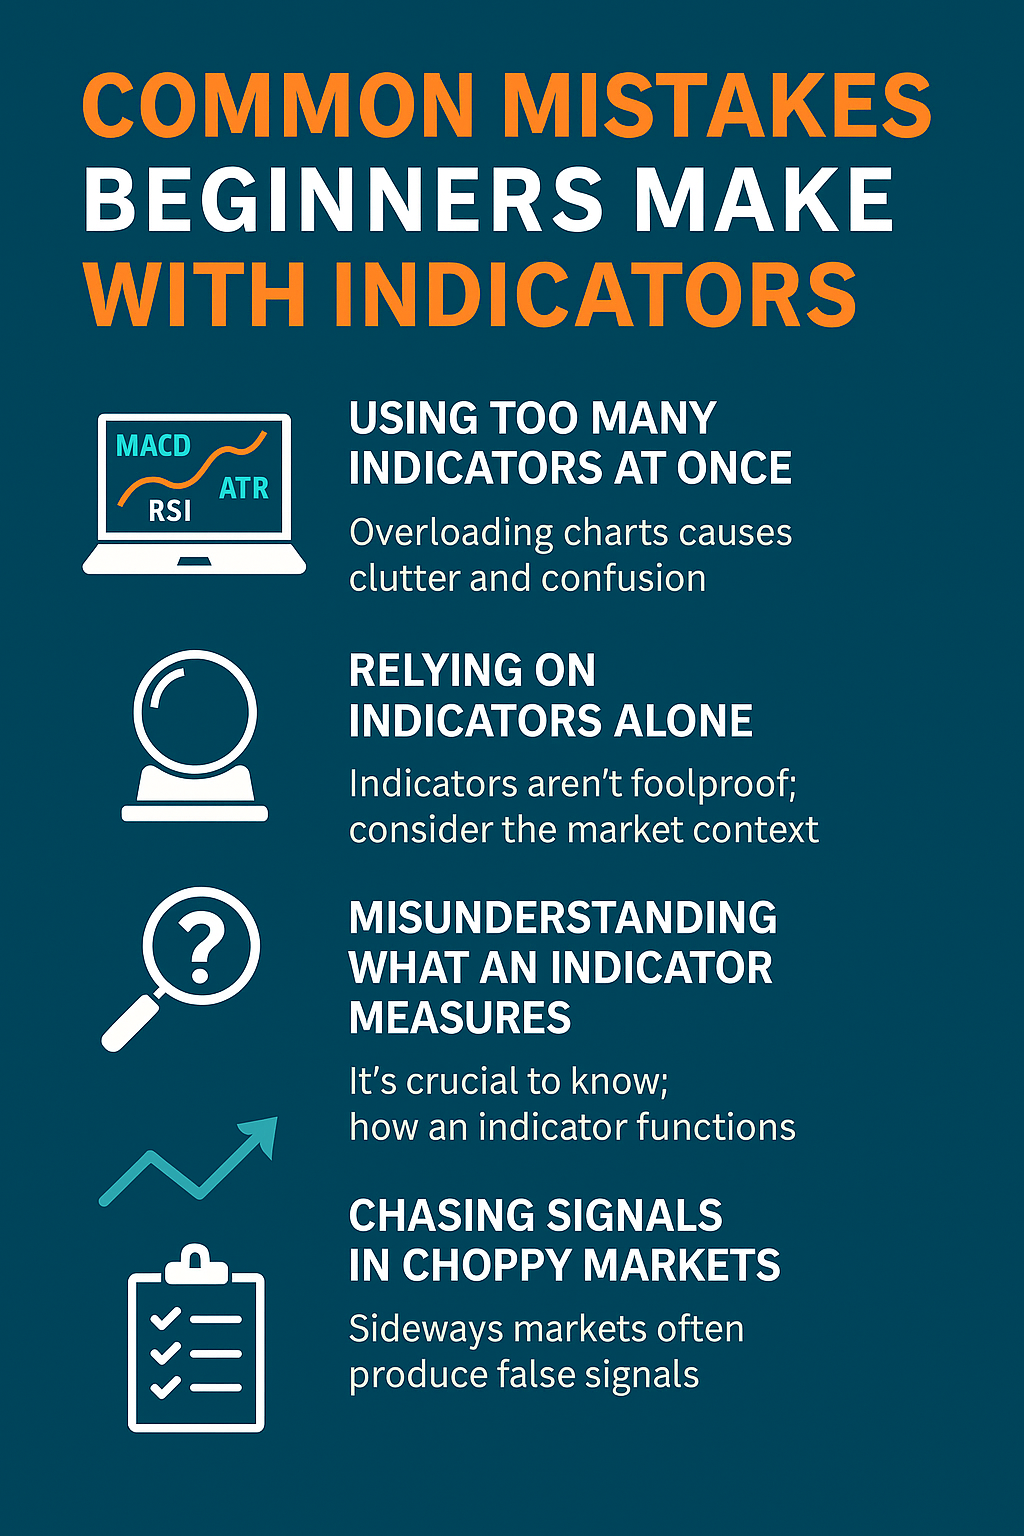
One of the biggest mistakes is overcrowding the chart with all the possible indicators. New traders tend to believe the more you have, the better. The truth is otherwise. Having five or six tools all yelling at you with different messages causes confusion rather than clarity.
Rather than assisting you in making improved decisions, it hinders you and promotes hesitation. Cleaner, less cluttered arrangements with only two or three carefully selected indicators will always work in your favor.
Another big mistake is treating indicators as if they are crystal balls. Indicators are tools, not oracles. They help you interpret the market, but they’re not infallible.
Many new traders follow indicator signals blindly without considering the broader context, such as key support and resistance levels, volume, market news, or the overall trend direction. That kind of tunnel vision can lead to poor entries and exits, even if the indicator itself isn’t “wrong.”
Most technical errors come from ignorance regarding the way an indicator functions. For instance, one may utilize RSI as expecting to predict the direction in which the price will move in the future while it actually gauges momentum in the recent timeframe.
Or perhaps employ a lagging trend indicator such as a moving average to capture breakouts — only to see it respond too slowly. To effectively employ it, it is critical to understand what the indicator is telling you — and what it is not telling you.
Beginners also tend to overtrust indicators in sideways, unpredictable markets. During these “chop” phases, most indicators throw off mixed signals or generate frequent false alerts.
Trying to trade every wiggle in the chart usually leads to losses from overtrading. It’s important to recognise when the market isn’t offering good setups — and sometimes, the best trade is no trade at all.
Finally, many traders jump straight into live markets without testing their indicator setups. Just because a strategy looks good on a YouTube video doesn’t mean it’ll work for your style or in current market conditions.
Skipping backtesting and practice is like skipping rehearsals before a big performance — you’re more likely to freeze when things get real. Paper trading or demo accounts are your training ground. Use them.
Pour réussir dans le day trading, il ne s'agit pas de prédire l'avenir, mais de mettre toutes les chances de votre côté grâce à des outils intelligents et à une exécution disciplinée. Des indicateurs tels que l'EMA, le RSI et la MACD ne garantissent pas des profits, mais ils vous aident à lire le marché avec clarté, à chronométrer vos entrées et vos sorties avec précision et à baser votre stratégie sur la logique plutôt que sur l'émotion.
Si vous voulez vraiment faire passer votre jeu de trading au niveau supérieur, ne vous arrêtez pas là. Approfondissez vos connaissances grâce à des guides d'experts, à des outils de trading et à des informations de marché en temps réel sur Centre éducatif Atmexx — votre source fiable pour maîtriser l'art et la science du day trading.
Vous en voulez encore plus ? Visitez notre tout nouveau base de connaissances pour des réponses pratiques, des didacticiels de trading et des guides stratégiques conçus pour les traders sérieux.
Quels sont les meilleurs indicateurs techniques pour les débutants ?
Le RSI, le MACD et l'EMA font partie des indicateurs les plus adaptés aux débutants en raison de leur clarté et de leur fiabilité.
Puis-je me fier à un seul indicateur de trading ?
Non recommandé. La combinaison de deux ou trois indicateurs complémentaires permet d'obtenir une image plus complète du marché.
Quelle est la différence entre les indicateurs avancés et les indicateurs retardataires ?
Les indicateurs avancés prédisent les mouvements potentiels des prix, tandis que les indicateurs retardataires confirment les tendances existantes.
Dois-je utiliser les mêmes indicateurs pour tous les actifs ?
Pas toujours. Certains indicateurs fonctionnent mieux avec des actifs volatils, comme les cryptomonnaies, tandis que d'autres sont plus adaptés aux actions stables ou au Forex.