
Fundamental Analysis (Part 3)
Understand the basics with our interactive market course.
Major economic indicators
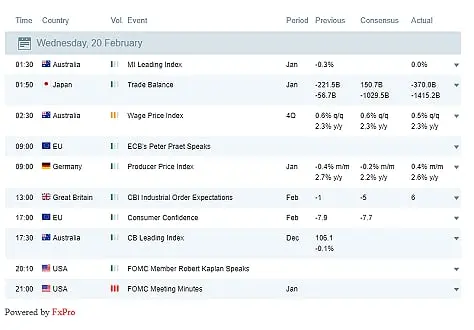
Go to the Economic Calendar on Atmexx.com and look for major economic indicators marked with two or three exclamation marks.
These symbols highlight key data releases that can strongly impact the currencies of the related countries.
Traders usually focus on the difference between the actual data and the forecast. The larger the gap, the more price volatility you can expect on the chart of the affected asset, most often the national currency of the country that released the news.
Major economic indicators
As a beginner, you’ll most often focus on U.S. economic news, since it's generally easier to understand. This means your main attention will be on the U.S. dollar (USD).
If the published U.S. statistics are better than expected, the value of the dollar may rise. In this case, the EUR/USD chart moves down, because the dollar is listed second in the pair. When the dollar strengthens, it means that one euro buys fewer dollars, so the price of the pair falls.
If you prefer a simpler setup, you can trade the USD/JPY pair instead. The dollar is first in this pair, and the Japanese market is usually closed by the time U.S. data is released. So, if the news is good for the dollar, the USD/JPY chart moves up, because there's a direct relationship between dollar strength and price movement.
Building Permits
What is it? This report shows the total number of building permits issued in the U.S. each month.
Why it matters: It provides early signs about the future of the U.S. economy. That’s why traders watch this indicator closely when trading currency pairs with the U.S. dollar (USD).
When it’s released: Around the 17th–18th of each month.

Consumer Confidence Index (CCI)
What it is: The CCI measures how confident people feel about the current and future state of the economy. It is based on survey responses about their plans for future spending.
Why it matters: When consumer confidence is high, people are more likely to spend money. This supports economic growth, boosts the national economy, and often strengthens the national currency.
When it’s released: On the last Tuesday of each month.

Consumer Price Index (CPI)
What it is: The CPI measures changes in the cost of living by tracking the prices of a set group of consumer goods and services such as food, housing, transport, and healthcare. It is commonly used to assess inflation levels.
Why it matters: CPI is a key lagging indicator. It helps traders predict possible interest rate changes, which can affect currency value.
When it’s released: Every month.

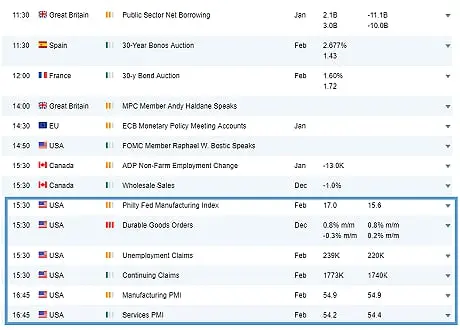
Durable Goods Orders
What it is: This indicator tracks the number of new orders placed with manufacturers for durable goods like engines, machinery, and equipment.
Why it matters: It gives insight into the pace of economic growth. A higher number of orders suggests that factories will have more work in the future, which can lead to increased production, higher employment, and stronger sales.
When it’s released: Around the 20th of each month.

Labour Cost Index
What it is: This index tracks changes in wages, bonuses, and employee benefits across all non-agricultural sectors. The data is based on surveys collected from employers.
Why it matters: The Labour Cost Index is closely tied to inflation. Since employee compensation is a major business expense, rising labour costs can lead to higher prices overall. The US Federal Reserve monitors this index carefully and often uses it when deciding on economic policy or potential interest rate adjustments.
When it’s released: Quarterly.

Gross Domestic Product (GDP)
What it is: GDP measures the total value of all goods and services produced within a country over a quarter or a full year. This report often causes strong movements in the exchange rate of the national currency. GDP figures are released not only in the United States, but also in countries like Canada, the UK, Japan, and others.
Why it matters: GDP allows traders to compare the economic growth of different countries. This helps forecast the movement of currency pairs and make better trading decisions based on the overall strength or weakness of an economy.
When it’s released: Quarterly.
Number of new foundation bookmarks
What it is: This report shows how many new houses began construction in the previous month.
Why it matters: Housing starts are closely linked to economic growth. For example, a steady drop in US construction projects may signal a coming recession. On the other hand, rising construction activity suggests a healthy economy. This indicator also influences the value of the US dollar (USD).
When it’s released: Around the 17th of each month.

Changes in Industrial Production
What it is: This report shows the total amount of goods produced in the country during the past month. It includes financial data from industrial companies, factories, mining, and energy sectors.
Why it should be followed: It is considered a coincident indicator, meaning it reflects what is currently happening in the economy. The report shows which sectors are growing, helping to identify the current trend of the national currency. It also gives early signs of changes in employment, average wages, personal income, and inflation.
When data is published: Between the 11th and 12th of each month.


.svg)