
Technical Analysis
Understand the basics with our interactive market course.
What is technical analysis
Technical analysis is an important part of trading.
Of course, every trader wants to know where the price will go next. The good news is that the answer is often hidden in the live price chart.
Even beginners can start exploring the trading platform and searching for patterns, and surprisingly, these patterns really do exist. A price chart is like a universal language, similar to how mathematicians communicate. A professor in any country can easily understand parabolic shapes and standard formulas, and the same is true for many chart patterns in trading.

What is technical analysis
Traders and analysts worldwide share a common approach: they’ve created a unique language to identify trading signals and execute trades using different strategies. These signals are often found through what are known as technical indicators.
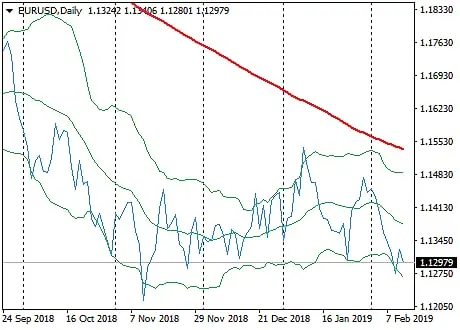
Technical indicators consist of one or several lines that either overlay the price chart or appear beneath it. They help traders interpret market movements and make informed decisions.

What is technical analysis
Indicators show the direction of the main trend, while oscillators highlight key turning points in the market. Both rely on specific formulas that are automatically calculated, presenting the results visually on the chart.
Many traders believe that using several indicators together provides a clearer view of the market and improves the accuracy of price forecasts.

What is technical analysis
Technical indicators generally fall into two categories: trend indicators (also called lagging) and oscillators (advanced).
Trend indicators are mainly used to confirm whether a price trend exists, often signaling only after the trend has already begun.
What is technical analysis
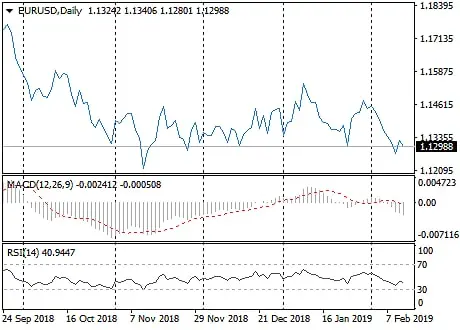
Oscillators aim to signal upcoming trend reversals before they happen. They evaluate how strong the current price movement is and highlight whether:
- the upward or downward momentum remains strong,
- or a correction (an expected price reversal in the opposite direction) is likely imminent.
Trend line
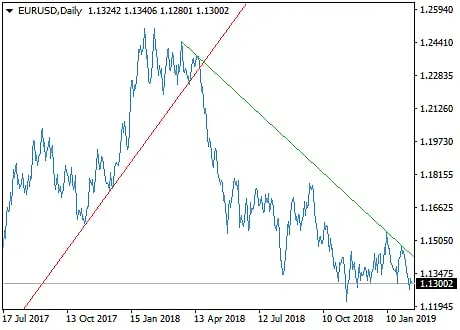
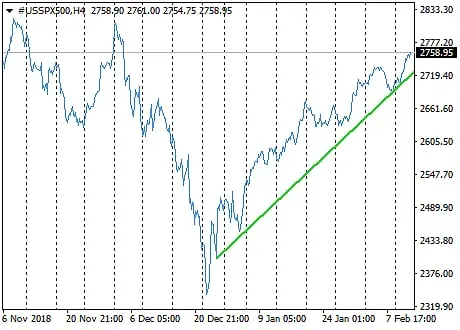
The trend line is one of the fundamental tools in technical analysis. Its primary role is to identify and highlight the current direction of the price.
To add this indicator on the chart, select at least two high points and two low points, then use the Trend Line tool on the Atmexx platform to connect them.
Trend line
An upward trend is identified when the highs and lows on the price chart steadily rise. If the price falls below the previous low point, this signals a possible reversal of the trend.
Trend line
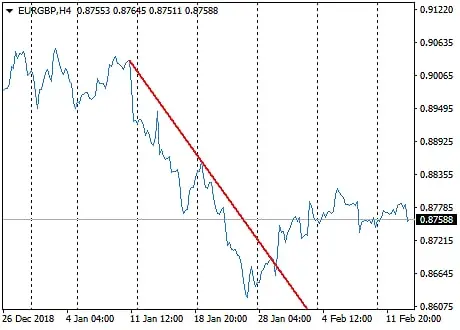
The downward trend happens when the price keeps making lower peaks and lower troughs over time.
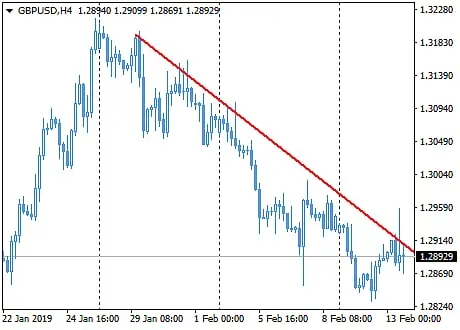
Trend line
(or flat) occurs when the highs and lows remain roughly at the same level without significant upward or downward movement.
Trend line
Trend lines help traders identify key pivot points where the price is more likely to rise (1) or fall (2).
Keep in mind that the more signals supporting an upward or downward move you observe, the stronger that trend is. It’s generally more difficult to break a well-established trend than one that has just begun.
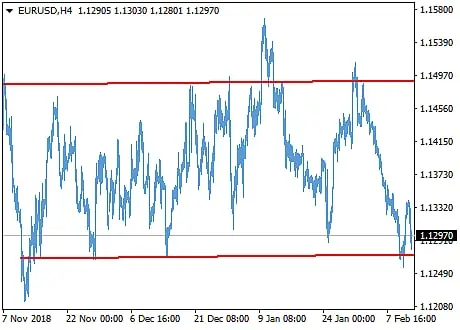
Support and resistance in forex
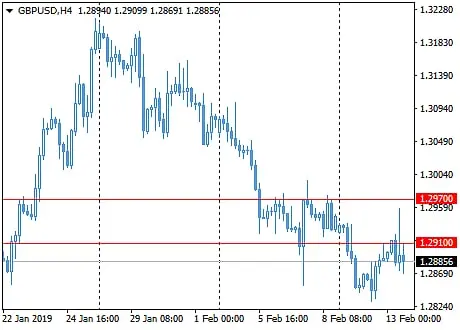
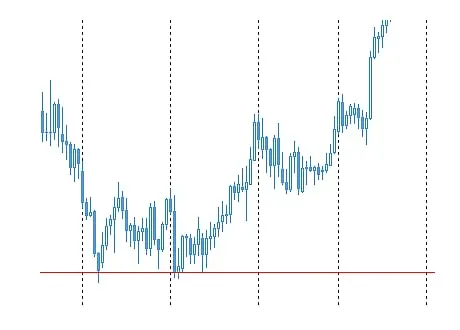
Look at this chart, we’ve added two horizontal levels. Unlike trend lines, support (at the bottom) and resistance (at the top) are always horizontal.
To draw these levels yourself, look for points where the price often stops or reverses. These are the areas where the market repeatedly reacts.
In the chart on the right, the resistance level marks the upper boundary of the price channel, while the support level marks the lower boundary.
Support and resistance in forex
Keep in mind that the explanation above applies only to upward trends. For downward trends, the roles are reversed: the resistance level acts as the lower boundary, while the support level becomes the upper boundary.
When the price breaks through either of these levels, it often signals a strong possibility of further decline or rise.
Support and resistance in forex
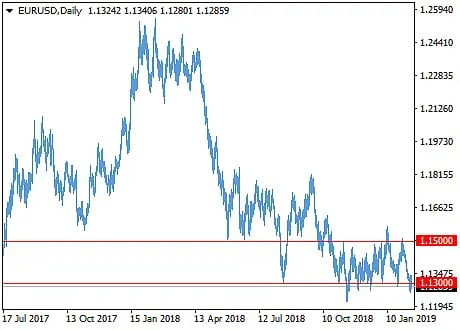
At times, it can be difficult to identify clear support or resistance levels. In such cases, it’s better to define zones or areas instead.
On the Atmexx trading platform, you can mark support and resistance using either the candle bodies or their shadows.
How to use support and resistance levels?
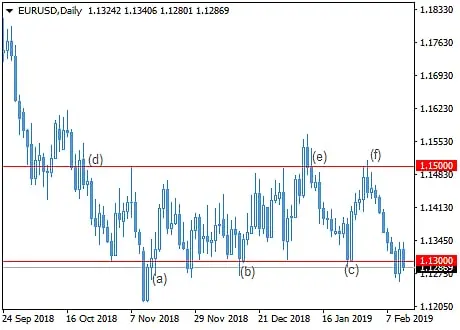
Check the chart: points (a), (b), and (c) can be great spots to open Buy trades, while points (d), (e), and (f) offer good chances for Sell positions.
Keep in mind, though, that support and resistance signals alone aren’t enough. It’s important to confirm your decisions using technical indicators (which we will cover in the next lessons).
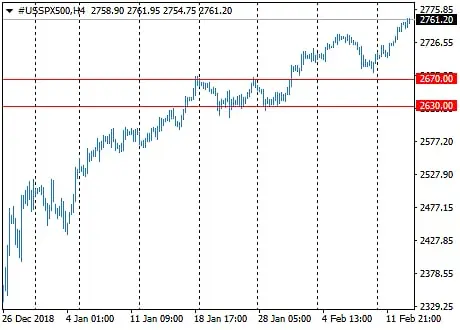
Support and resistance in forex
Keep in mind that support levels can later turn into resistance levels, and vice versa, depending on whether the asset price rises or falls.
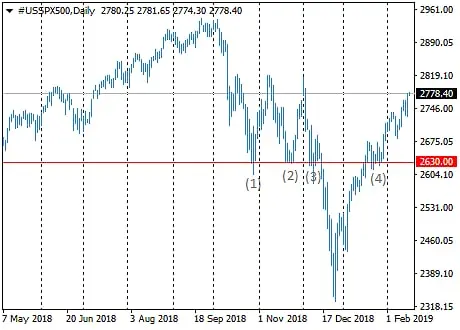
Take a look at the chart: the asset price touched the resistance level twice at points 1 and 2. Once the price broke beyond the range, that resistance level became a new support level at points 3 and 4.
Support and resistance in forex
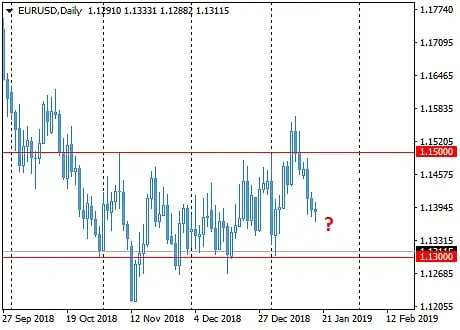
How can you determine whether the asset price is merely testing a support or resistance level or about to break through it and move further?
Typically, the more frequently the price reaches a certain level and then reverses (tests it), the stronger that zone becomes, making it more difficult for the price to break past it. It’s generally not advisable to enter trades when the price is stuck between support and resistance, as the future direction can be unpredictable.
Support and resistance in forex
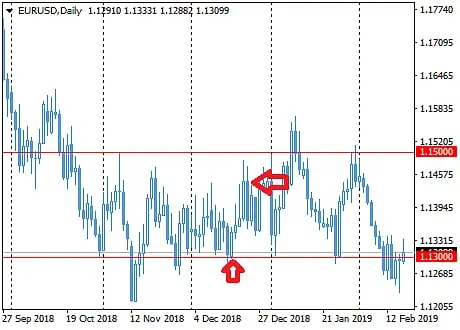
It’s ideal to open a position once the price begins moving between levels, specifically after the first new candle forms away from the boundary inside the range.
Keep in mind, it’s wise to close the trade before the price reaches the opposite level, as the price might not reach that line at all.
Support and resistance in forex
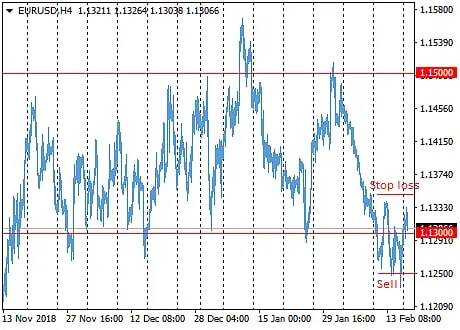
If the price breaks below the support level, wait for 1–2 candles to confirm the breakout before opening a trade in that direction.Keep in mind that, in this scenario, the previous support level will now act as resistance.These examples are for illustration purposes only and should not be taken as trading advice.
Where is the best place to set a Stop Loss?
For example, if you open a trade 5 pips below the Support level, it makes sense to place your Stop Loss 5 pips above that same level.
Where is the best place to set a Stop Loss?
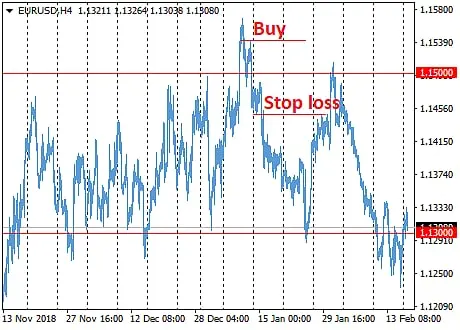
Likewise, if the asset price breaks through the Resistance level, you can open a trade about 5 pips above that level, placing your Stop Loss just below it.
Channel trading forex
Trading channels are another important tool in technical analysis used to identify precise entry points. They are usually formed using Trend lines and represent the area between two parallel lines that contain the price movement.
Most often, channels appear during upward or downward trends, outlining the price range in which the asset is moving.
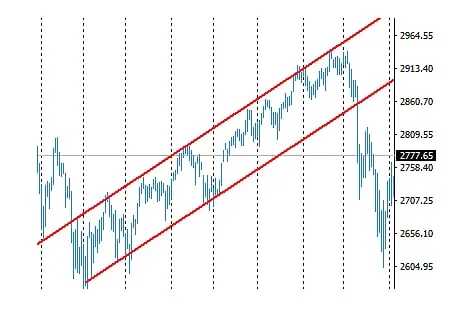
There are three main types of trading channels.
An ascending channel is identified by a series of progressively higher highs and higher lows.
A downward channel is characterized by consistently lower highs and lower lows.
A Side channel is formed when each new high and low appear at about the same level as the ones before.
Graphic models
You might be surprised, but price charts often form specific shapes called graphic models (or graphic patterns).
At first, spotting these patterns on a live chart can seem difficult. But with regular practice, you’ll learn to recognize what pattern is forming and how to make trading decisions based on it.
Graphic models
Graphic models are generally divided into two types: continuation and reversal.
Continuation patterns suggest that the current price trend will probably continue.
In contrast, reversal patterns indicate that the price may soon move in the opposite direction.
Graphic models
Let’s explore some of the most common graphic patterns.
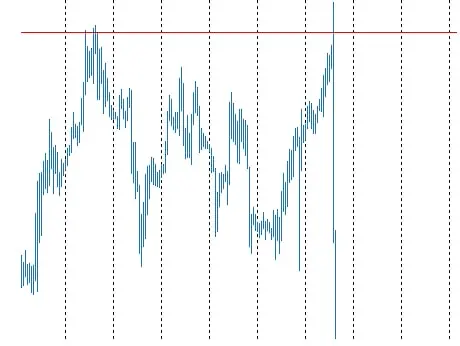
Double top.
This is a reversal pattern. Notice how the price tries to rise twice, hitting a resistance level both times but failing to break through. After this, a downward trend usually begins.
The Double top looks like the letter "M" on the chart. When traders spot this pattern, they often open Sell positions after 1 or 2 candles form following the second drop from the resistance.
Graphic models
Double Bottom
The double bottom pattern looks like the letter “W” and typically appears after a prolonged downtrend. Unlike the double top, this pattern signals a reversal upward after the price bounces off the support level twice.Once the second rebound is confirmed, traders often enter Buy positions, waiting for 1 or 2 candles to validate the move.
Graphic models
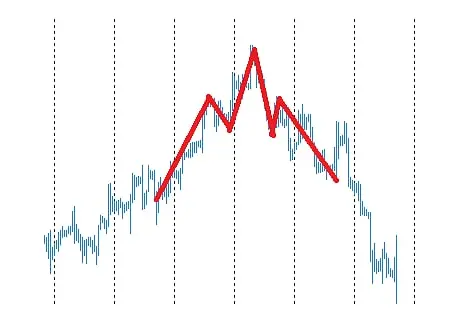
Head and Shoulders
This is one of the most well-known graphic patterns, usually appearing during an uptrend.
The pattern is made up of three peaks: the first peak is the left shoulder, followed by a higher peak called the head, and finally a lower peak, which forms the right shoulder.
This formation indicates that after the right shoulder is completed, the price is likely to reverse and start a downtrend.
Pay close attention to the neckline, the support level where the price bounces off. When the price breaks below this neckline, traders look for the right moment to enter Sell positions.
Graphic models
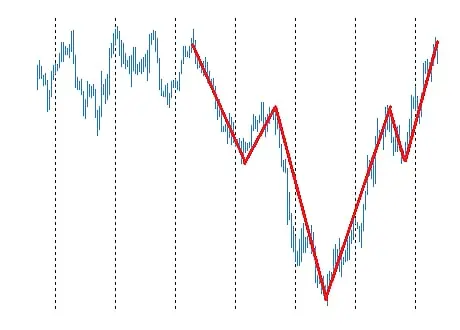
Inverted Head and Shoulders
This pattern is the mirror image of the regular Head and Shoulders. In this case, the neckline acts as a key level for opening Buy trades.
Traders should carefully watch the chart and wait until a candle closes above the neckline before entering a position.
Opening a trade too early is not advised, as the price could quickly reverse, indicating a false signal.
Graphic models
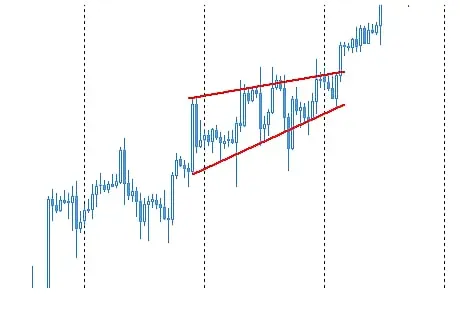
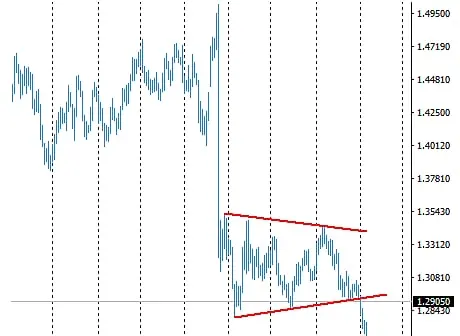
Rising Wedge
This pattern signals a pause in the current trend and reflects a period of market uncertainty. After the wedge forms, the trend may either continue or reverse.
When a rising wedge appears during a downtrend, it usually acts as a continuation pattern. As illustrated in the chart on the right, the price breaks below the resistance line and keeps falling.
However, when a rising wedge forms during an uptrend, it usually signals a reversal. This happens because the price hits the resistance line and then starts to drop.
Graphic models
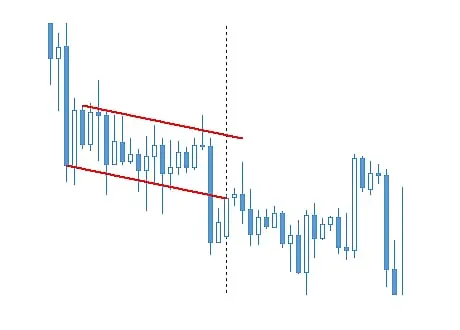
Falling Wedge
This pattern can signal either a trend reversal or continuation.
Unlike the Rising Wedge, a falling wedge is usually followed by a price increase.
When it forms after a downtrend, it suggests an upcoming upward reversal.
Conversely, if it appears during an uptrend, it confirms that the price will likely keep moving higher.


.svg)