
.svg)

Share
Open a cryptocurrency account and earn profits from digital currencies.

Related articles
Author
Constantine Blake
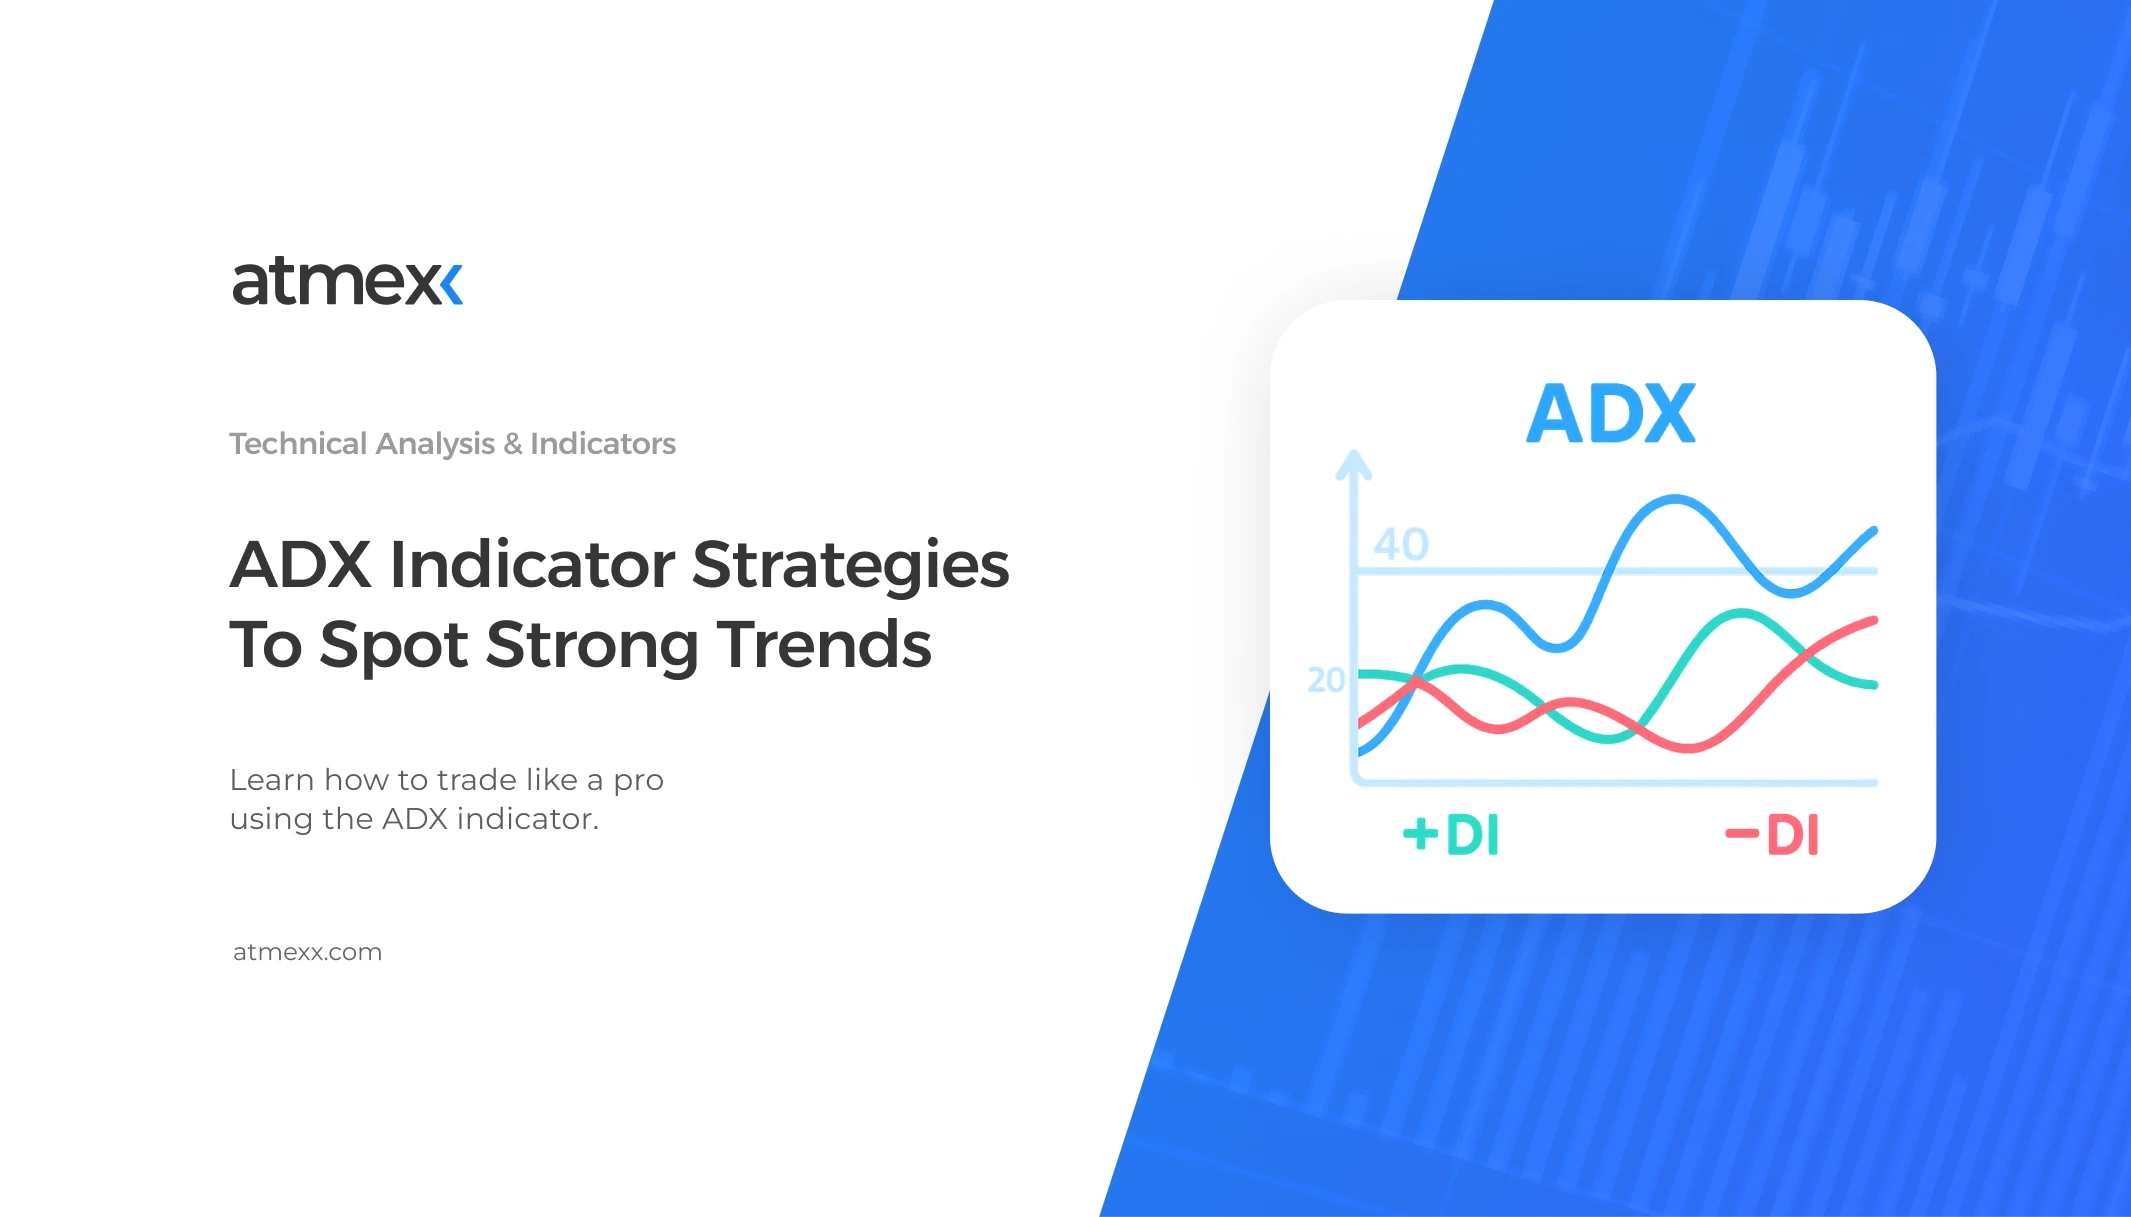
Are you tired of jumping into trades just to watch the market stall or reverse on you? You're not alone — and you're definitely not powerless. The key might lie in one of the most overlooked yet powerful tools in technical analysis: the ADX indicator. More than just a trend detector, ADX tells you how strong the move is — helping you dodge fakeouts and ride trends with confidence.
Whether you're a curious beginner or a seasoned trader, this guide will show you how to spot strong trends like a pro and fine-tune your strategy with precision.
The average directional index (ADX) serves as a gauge of market trend strength. It doesn't care whether the price is going up or down — its sole job is to tell you how strong the trend is. Imagine you're driving a car: the ADX isn't telling you which direction you're headed, but how hard you're pressing the gas pedal. That's powerful information for any trader.
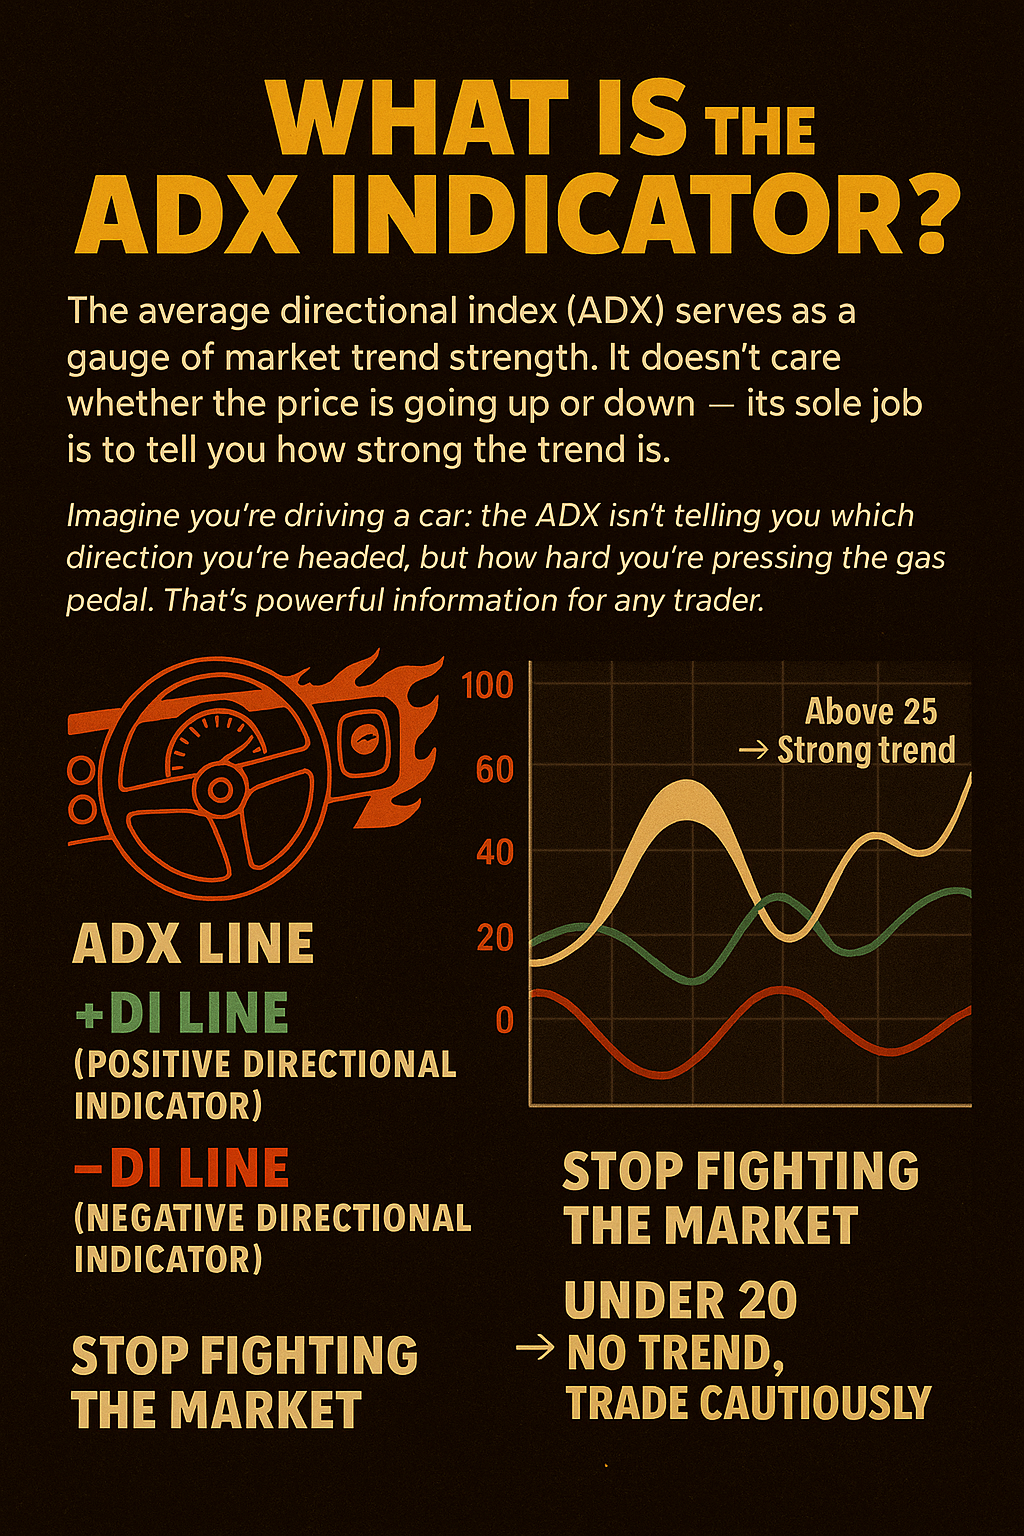
Developed by J. Welles Wilder back in the late 1970s, the ADX was originally part of a larger system called the Directional Movement System. It includes three lines:
Here's how they work together:
The ADX line measures trend strength on a scale from 0 to 100. When the number is high (say, above 25), it indicates a strong trend — whether bullish or bearish.
The +DI and –DI lines indicate who is in control — buyers or sellers. If the +DI is above the –DI, the bulls are winning. If it's the other way around, the bears have the upper hand.
However, the real magic lies in how traders utilise the ADX: not to predict trends but to respond to them intelligently. For example, if the ADX is rising above 25, it's often a green light to start trend-following strategies — think riding the wave, not guessing when the wave will begin.
In short, the ADX helps you stop fighting the market. It tells you whether the market is worth trading at all — because if the ADX is under 20, it might be time to wait it out or switch to a range-bound approach.
The ADX might come across as a technical tool at first, but at its core, it does something very intuitive: it tells you how strong a trend is, regardless of whether it’s moving up or down. For traders who want to avoid false starts and wasted entries, this can be a game-changer.
Underneath the surface, the ADX measures the size of recent price moves — basically comparing how far prices stretch from one day to the next. Then, it smooths that data into a single line that reflects the momentum behind the trend.
Crucially, the ADX doesn’t care if the market is bullish or bearish. It only cares about intensity. Is the market pushing hard in one direction — or is it meandering without purpose? That’s what the ADX reveals.
It’s often paired with two supporting lines, +DI and –DI, which indicate whether buyers or sellers have the upper hand. The ADX line then indicates whether that dominance is actually significant or merely background noise.
A good way to think about it: if the market were a boxing match, the +DI and –DI show who’s landing more punches, and the ADX tells you how powerful those punches are.
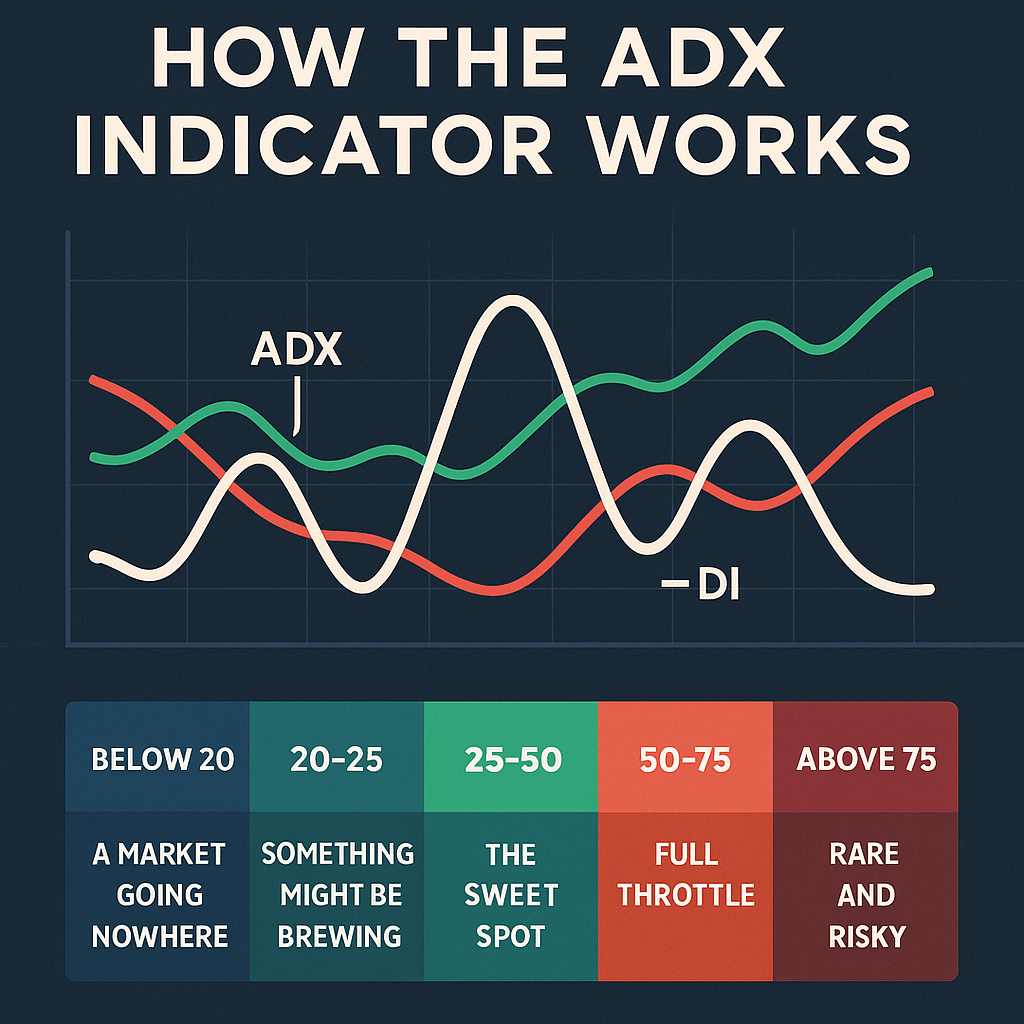
At this level, the market is stuck in a rut. Price might wiggle around, but there’s no real trend developing. These are typically choppy and frustrating environments for trend traders.
This range signals early signs of trend formation. It’s not a confirmation yet, but momentum could be building. Think of it like clouds gathering before a storm — worth watching closely.
This is where the action happens. Trends become more reliable, and price moves tend to have follow-through. Many professional traders wait for the ADX to enter this zone before committing to a position.
Here, the trend is not just strong — it’s accelerating. These moves are often driven by strong sentiment or major market catalysts. It’s exciting, but it also requires caution, as markets can become overheated.
Trends this strong are usually tied to extreme events — such as market crashes, euphoric rallies, or breaking news. They can offer big rewards, but they can also turn around just as fast. If you’re trading here, risk management becomes everything.
The real power of the ADX indicator shines when you apply it in context — not just as a number, but as a decision-making filter. Here are four proven strategies that utilise the ADX in various ways, tailored to your trading style and the market's behaviour.
Use case: Spotting the beginning of a new trend — ideal for traders who want to catch moves early, just as momentum is building.
One of the most frustrating aspects of trading is entering a trend too soon only to see the price fizzle out. That's where the ADX comes in — it helps you avoid false breakouts and focus only on trends that have real strength behind them.
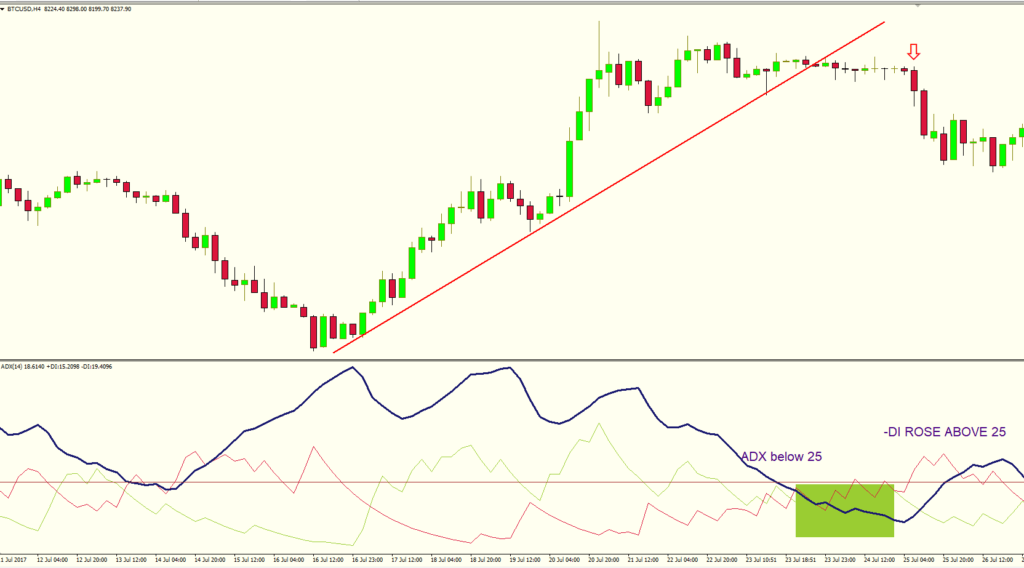
Here's how it works: Wait for the ADX to rise above 25, which indicates that the market is emerging from a period of low volatility. Next, check for a +DI crossing above –DI (for bullish trades) or vice versa for shorts. This confirms that there's directional conviction — not just random movement.
Once those conditions are met, enter in the direction of the dominant DI line. Set a stop-loss below the recent swing point, and let the ADX guide your confidence: if it keeps rising, the trend is likely gaining steam.
Use case: Jumping into an already strong trend on a temporary dip — great for traders who prefer confirmation before acting.
Not every trend starts with a clean breakout. Sometimes, the best entries occur after the initial push, when the price takes a brief pause. The ADX Pullback strategy helps you catch these opportunities.
First, you want to see that the ADX is holding steady above 25 or 30 — this confirms that you're in a trending environment. Then, wait for the price to pull back against the dominant trend. You might see this as a minor retracement or a consolidation candle.
To increase accuracy, use a second indicator, such as the Stochastic Oscillator or RSI, to identify oversold conditions in an uptrend (or overbought conditions in a downtrend). Once those conditions align, look for a price rejection signal — such as a pin bar or engulfing candle — to time your entry.
Enter in the direction of the overall trend and trail your stop as the ADX rises. If ADX starts to flatten or drop, it may be time to take partial profits or close the trade.
Use case: Filtering out sideways markets to avoid whipsaws — especially helpful for day traders and scalpers.
Some of the worst trading days are those when the market goes nowhere — chopping back and forth with no real conviction. These conditions eat up capital and confidence. The ADX is a great filter to help you sit out when you should.
The approach is straightforward: if the ADX is below 20, it's a warning sign. The market lacks sufficient strength to sustain any meaningful move. During these periods, avoid trend-following setups altogether. If you must trade, switch to range strategies — like buying support and selling resistance — but with extra caution.
This strategy doesn't tell you when to enter. It tells you when NOT to — and sometimes, that's the most valuable signal of all.
Use case: Identifying potential trend reversals when the ADX and price action move in opposite directions — a more advanced but powerful concept.
Most traders are familiar with price/indicator divergence (like between price and RSI or MACD). But ADX divergence is a more subtle signal that can hint a trend is running out of gas — even if the price hasn't reversed yet.
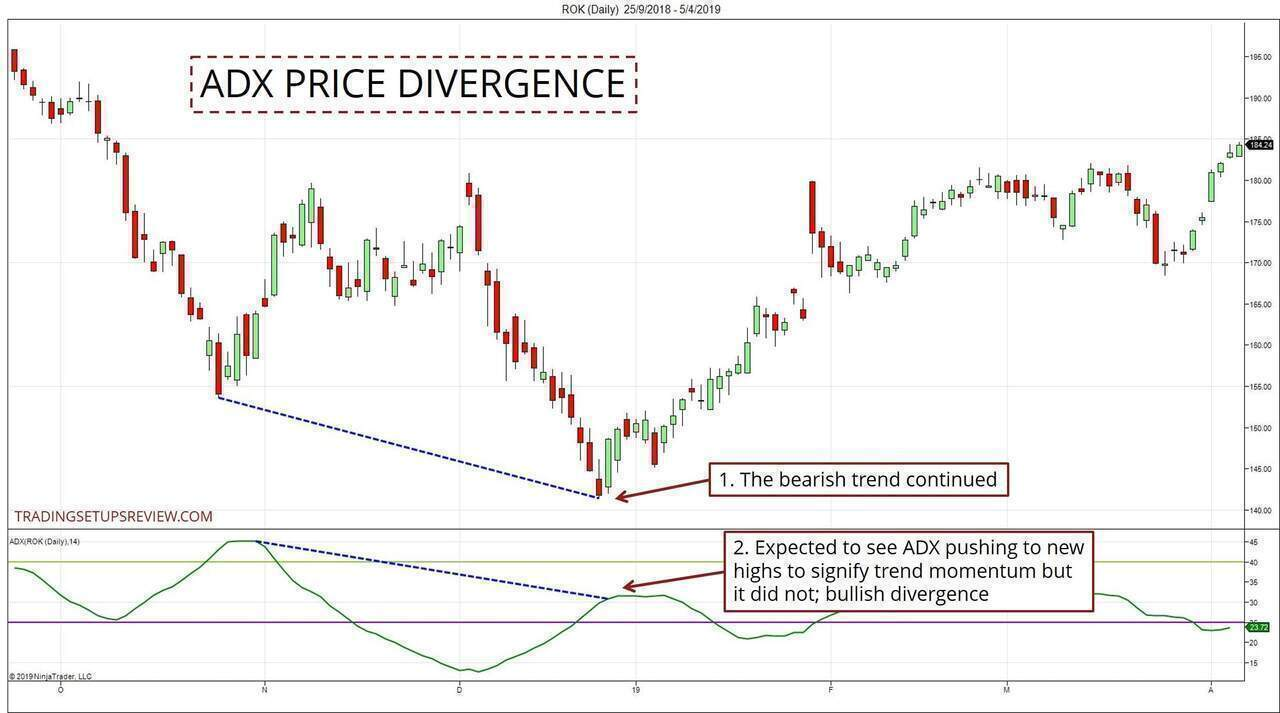
Here's the setup: Let's say the price is making higher highs, but the ADX is making lower highs. This indicates that, although the trend appears to continue visually, its underlying strength is fading. It's like a sprinter who's still running forward but is visibly tiring.
In these moments, aggressive traders might look for early reversal signals, while conservative traders may simply tighten stops or prepare to exit. The divergence itself doesn't trigger the trade — it's a heads-up that the trend may be near exhaustion.
The ADX indicator is one of the most underrated tools in technical analysis. It's a favourite among professionals and a hidden gem for beginners learning trades. But like any indicator, it has its limits — and using it incorrectly can lead to poor decisions, unnecessary losses, or missed opportunities.
Here are the most common mistakes traders make with ADX and how to avoid them — whether you're using the best trading platform or just starting out with your demo account on the best online broker.
One of the biggest misunderstandings in day trading is assuming that a low reading on the ADX indicator means the market is bearish. That's not how it works.
A low ADX — typically below 20 — simply means there's no strong trend in play. The market might be drifting sideways or slowly climbing, but it lacks real momentum. This is especially important for trading strategies that rely on trend-following — if there's no trend, those strategies don't work.
So, instead of shorting just because ADX is low, recognize it as a signal to be patient. Wait for trend confirmation or switch to range-trading strategies better suited for flat conditions.
Many traders fall into the trap of relying solely on the ADX. But even one of the best indicators for day trading needs support.
The ADX indicator shows how strong a trend is, but it doesn't tell you which direction to trade or where to enter and exit. For that, you need context — like chart patterns, support and resistance, or tools like RSI and MACD. When combined properly, these tools form a complete system that guides your decision-making with more confidence.
Even on the best online broker platforms, traders who use ADX without confirmation signals often find themselves jumping into trades too early or misreading trend strength.
ADX works well in stable, trending environments, but it can produce misleading signals during highly volatile conditions. For instance, during big news releases or flash crashes, you might see a sudden spike in ADX — not because a trend has formed but because the price is moving wildly in all directions.
This is especially risky on lower timeframes, where market noise is amplified. A smart approach is to apply a volatility filter, such as the Average True Range (ATR), or to confirm trends on higher timeframes before placing your trade.
Understanding how to interpret ADX in the context of volatility separates amateur mistakes from expert decisions — a key lesson for anyone serious about technical analysis.
Once you've grasped the basics of the ADX indicator, you'll quickly realise its real edge comes from how you use it — not just whether it's above or below 25. Pro traders don't just read the ADX; they apply it strategically, in sync with market structure, volatility, and their own trading system.
If you're only looking at a single timeframe — say, the 15-minute chart — you're missing the bigger picture. Pro traders know that multi-timeframe analysis is essential. The idea is simple: zoom out to see what matters, then zoom in to find your opportunity.
Let's say the ADX is rising on the 4-hour chart, signalling a strong trend. That tells you the broader market is moving with force. Now, you can drop down to the 15-minute or 1-hour chart to time your entry with a pullback or breakout in that same direction.
This layered view prevents you from trading against a dominant trend and gives your setups more credibility. It also helps you manage risk — you're not just reacting to local noise; you're trading with the full market context behind you.
ADX is a powerful filter — but on its own, it lacks timing. To truly sharpen your edge, combine it with price action techniques, such as candlestick patterns, breakouts, consolidations, and support and resistance zones.
For example, if the ADX is climbing above 25 and the price breaks through a major resistance level with a strong bullish candle — that's a high-quality signal. You're seeing trend strength and buyer intent together. On the other hand, if the ADX is strong but the price is forming indecision candles or rejecting key zones, it may be a sign to hold back.
The price action adds texture to your trades. It provides context — so you're not just following a number but responding to what the market is actually doing.
This is the secret weapon that separates casual traders from professionals: data-driven self-awareness.
If you want to know how well your ADX-based strategies work — test them. Backtest different scenarios, including breakouts, pullbacks, and divergences. Note the ADX levels that led to profitable moves versus those that didn't. Do certain asset classes respond better than others? Do some timeframes behave more cleanly?
But don't stop there — keep a trading journal. After each trade, jot down what the ADX was doing, why you entered, what went right (or wrong), and what you'd do differently next time.
Over time, this process helps you develop personalised trading strategies that align with your strengths and eliminate habits that cost you money.
The ADX indicator is more than just another line on your chart — it’s a decision-making compass for navigating volatile markets and avoiding costly mistakes. When paired with solid price action, thoughtful strategy, and a bit of discipline, it becomes one of the most effective indicators for day trading.
Ready to put your strategy to the test with a professional-grade platform? Start trading smarter with confidence — visit Atmexx and open your account today.
Want to deepen your trading knowledge? Explore our brand-new knowledge base — packed with practical strategies, indicator breakdowns, and expert insights to help you level up your trading game.
Is ADX suitable for beginners?
Yes! It's simple to read and ideal for learning how to judge market momentum.
What's the best ADX setting for day trading?
The default 14-period works well, but aggressive traders may prefer shorter periods, such as 7 or 10.
Can I use ADX on any market?
Absolutely — ADX works on forex, stocks, crypto, and even commodities.
What timeframe should I use for ADX?
Use higher timeframes (4H, daily) for confirmation and lower ones for entries.
Does ADX show when to buy or sell?
Not exactly. It tells you when a trend is strong — not when to trade. Use it with other tools.